


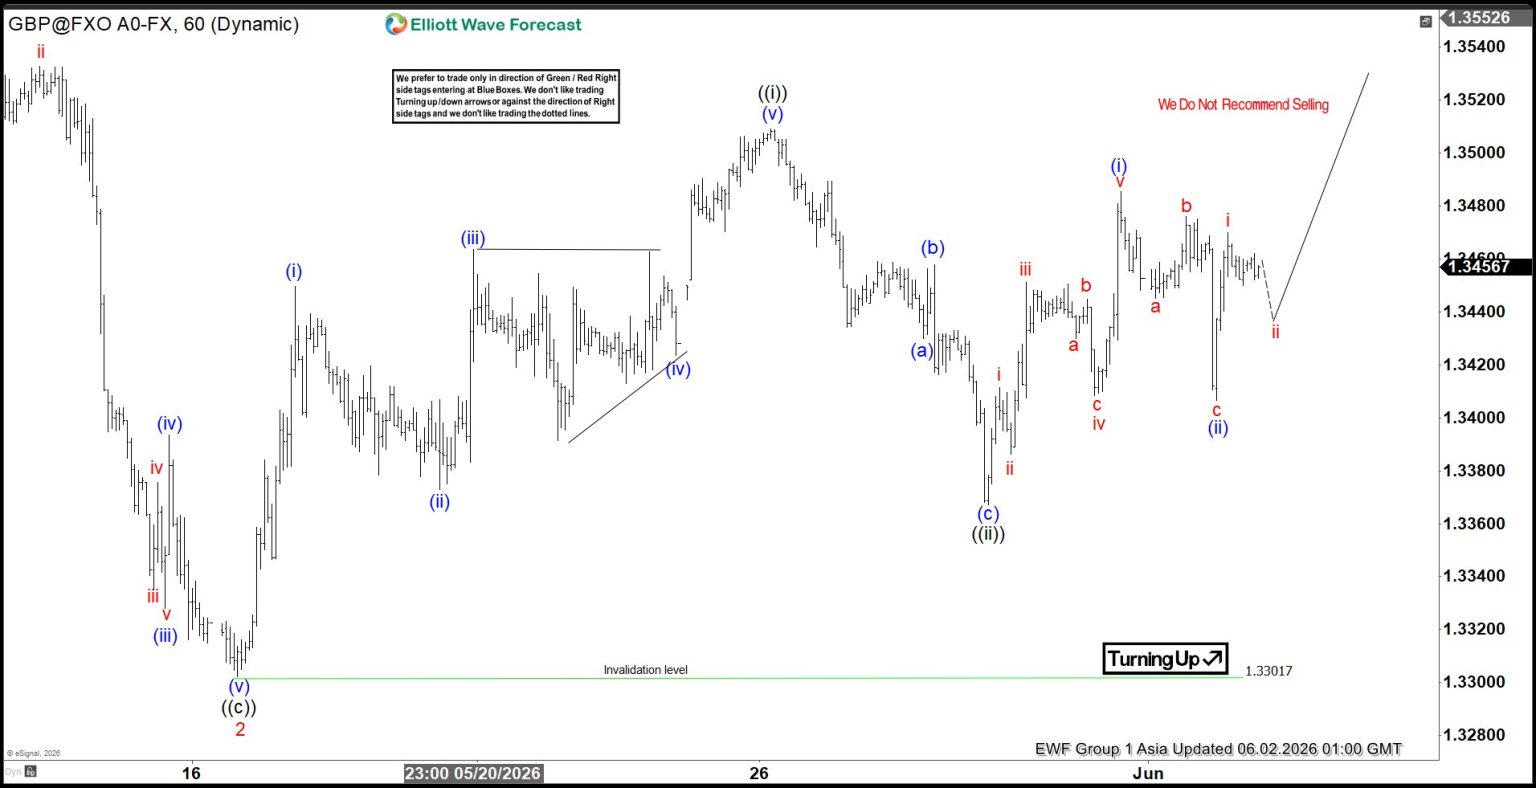
The short‑term Elliott Wave analysis shows that the GBPUSD rally from the March 31 2026 low is unfolding as a five‑wave impulse. Wave 1 peakedat 1.3658, followed by a corrective wave 2 that bottomed near 1.33. Wave 3 then extended the upward move, creating a clear impulsive pattern. Inside wave 1, sub‑wave (i) reached 1.345, sub‑wave (ii) pulled back to 1.337, sub‑wave (iii) climbed to 1.346, sub‑wave (iv) corrected to 1.342, and sub‑wave (v) finished at 1.35, completing wave ((i)).
Wave ((ii)) found support at 1.3367, after which the market resumed its upward move in wave ((iii)), reinforcing the bullish outlook. The five‑swing rally from the wave 2 low offers structural confirmation of the trend. From wave ((ii)), sub‑wave (i) advanced to 1.348, followed by a three‑wave corrective sub‑wave (ii) that settled at 1.34.
In the near term, as long as GBPUSD stays above 1.33, pullbacks are expected to attract buying interest. These retracements may develop in either three‑ or seven‑swing patterns, presenting opportunities for renewed strength. The broader structure indicates a constructive bias, with higher targets favored while the key support at 1.33 remains intact.
GBPUSD 60-Minute Elliott Wave Chart
GBPUSD Elliott Wave Video:
Also Read
- Franklin Templeton Files for ETFs That Convert Corporate Dividends into Bitcoin Exposure
- Japanese Yen Nears 40-Year Lows as Intervention Speculation Rises
- Europe’s MiCA July deadline puts Binance access and USDT liquidity on the line
- USD/CHF Price Forecast: Fails ahead of 0.8100/YTD peak; bullish potential intact