









TL;DR: Bitcoin and Ether have defended critical support levels twice within a week—Bitcoin near 80,365–80,953 and Ether near 2,407—but neither has surpassed key resistance to confirm the end of their recent corrections. Upcoming catalysts, including Wednesday’s US CPI data and ETF flow trends, will determine whether spot buying can sustain the rebound.
Market Context and Technical Resilience
Bitcoin and Ether rebounded sharply following a second wave of leveraged liquidations in less than a week. Bitcoin climbed from an overnight low of 80,953 to around 83,281, while Ether recovered from 2,407 to approximately 2,515. These quick reversals indicate that forced liquidations intensified the selloff without causing a sustained breakdown, suggesting underlying demand is holding.
However, maintaining support does not confirm a market bottom. Neither cryptocurrency has yet surpassed resistance levels required to signal the end of the correction. The declines from Bitcoin’s 87,354 and Ether’s 2,806 peaks are still analyzed as corrections within their preceding five-wave advance, rather than confirmed bearish reversals. The critical question remains whether spot demand can sustain the recovery once leveraged selling pressure subsides.
Two Waves of Liquidation, Similar Support, Rapid Reversals
The first major sell-off occurred on October 7–8 amid broader risk asset weakness, driven by rising US Treasury yields approaching multi-decade highs and concerns over AI investment valuations. The 10-year yield hit 5.365%, while elevated oil prices exacerbated inflation and interest rate fears.
Crypto markets had already shown weakening momentum before macro pressures intensified. The subsequent drop was amplified by leveraged liquidations and ETF redemptions. Per CoinGlass data, approximately $974 million in liquidations occurred within 24 hours, including around $896 million in long positions. US spot Bitcoin ETFs also recorded $484.9 million in net outflows on October 7, adding to selling pressure.
Bitcoin briefly touched 80,365.12, while Ether hit 2,407.04, before both rebounded. A second episode emerged late Monday into early Tuesday, with Crypto Briefing reporting $120 million in long liquidations within 15 minutes as Bitcoin dipped below $82,000. Bitcoin subsequently reached 80,953.41, establishing a higher low than October 8, while Ether’s low of 2,407.33 mirrored its previous session’s low nearly exactly. Both assets rebounded swiftly despite renewed weakness in Asian tech equities.
The consistent defense of support suggests liquidation-driven selling has not escalated into a broader collapse. However, the speed of recoveries alone does not confirm the correction’s conclusion.
Leverage Liquidations Versus Spot Demand
These episodes highlight the distinction between forced selling from leveraged positions and sustained selling from fundamental investors. Leveraged long positions are automatically liquidated during sharp moves, accelerating downward pressure. Once such force subsides, prices can rebound without requiring significant improvements in market sentiment. This aligns with Bitcoin and Ether’s rapid recoveries.
Nevertheless, liquidations do not address whether sufficient spot demand exists to sustain the bounce. The October 7 Bitcoin ETF outflow was sizable, but the broader flow trend showed mixed signals. Five-day net outflows totaled approximately $162.9 million, while the prior 30 days still registered net inflows of $1.76 billion, indicating short-term weakness rather than a structural exit by institutional investors.
Future ETF flows will clarify this dynamic. Continued redemptions could signal weakening underlying demand, making recoveries harder to sustain. Conversely, stabilizing flows alongside continued support defenses would reinforce the view that markets are adjusting within a broader uptrend rather than reversing irreversibly.
ActionForex’s Technical Outlook
Bitcoin: Correction May Extend Toward 76,040
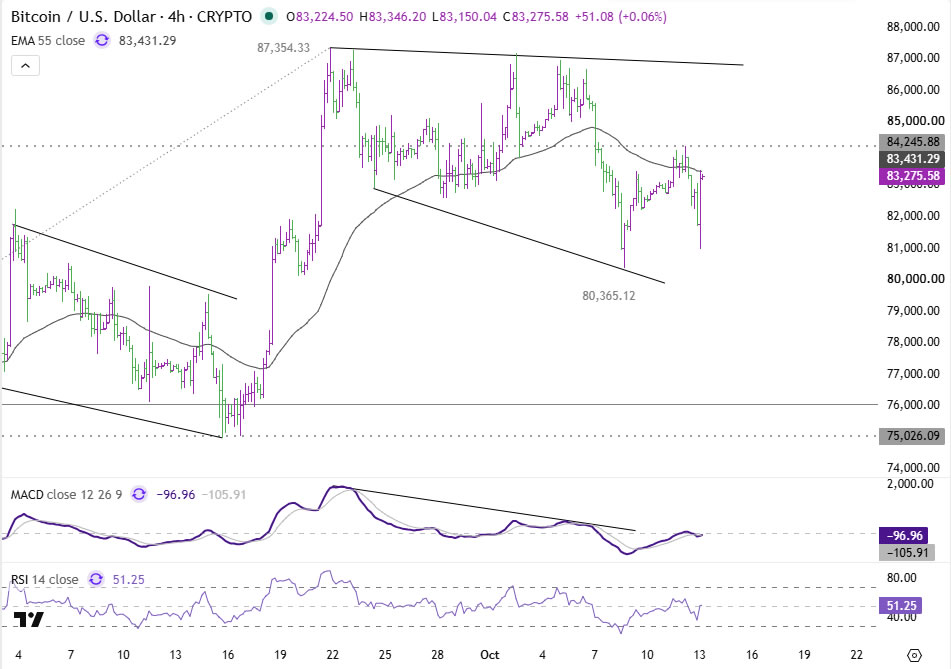
Bitcoin’s drop from 87,354.33 is interpreted as a correction to its advance from 57,736.97. The October 8 low of 80,365.12 aligned closely with the 23.6% Fibonacci retracement of this move. The subsequent higher low at 80,953.41 reinforces this support zone’s significance.
The daily chart remains bearish, with MACD divergence persisting and the prior rising trendline breached. Recovery attempts have faced resistance near the 4-hour 55 EMA at 83,431, suggesting the correction may not yet be complete. The next downside target lies at the daily 55 EMA (~79,703), followed by the 38.2% Fibonacci retracement level at 76,040.50. Support here converges with the September wave-four low at 75,026.09–76,040.50, potentially forming a pivotal zone for completion.
A decisive break above 84,245.88 would signal the correction’s end, opening the door to retesting 87,354.33.

Ether: Repeated Support at 2,407, But Key Resistance Looms
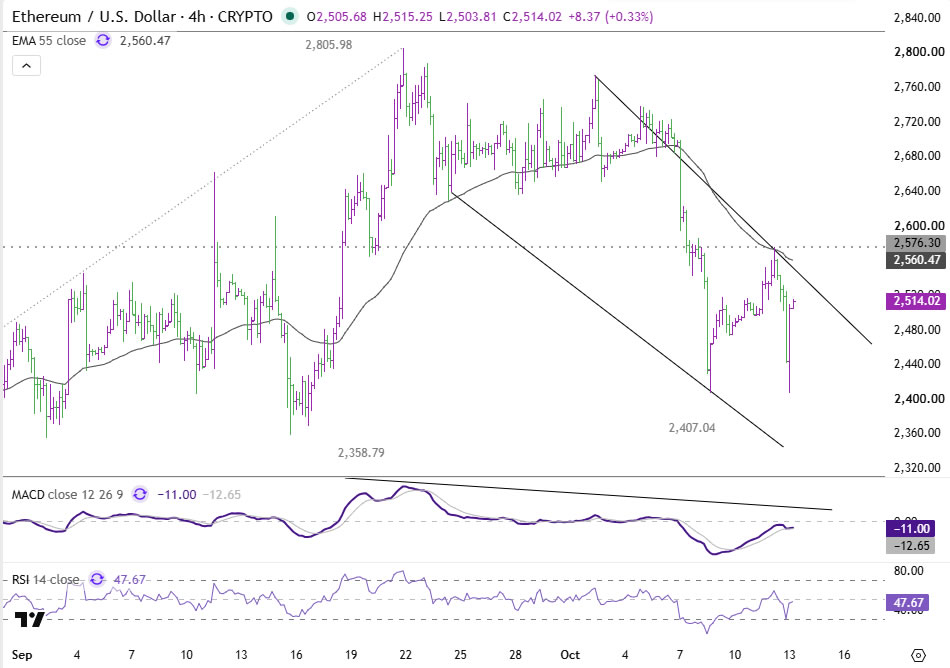
Ether’s decline from 2,805.98 is viewed as a correction to its prior five-wave rise from 1,510.07. The repeated defense of support near 2,407—reached at 2,407.04 on October 8 and 2,407.33 in the second sell-off—is critical. This level’s resilience suggests selling pressure has not overwhelmed the market.
Technical indicators remain unfavorable: Ether’s rising trendline is broken, and daily MACD signals weakening momentum. The latest bounce has struggled to surpass the 4-hour 55 EMA at ~2,560, reinforcing bearish sentiment. The next support level is the 38.2% Fibonacci retracement at 2,310.94 if 2,407 fails. A decisive close above 2,576.30 would indicate the correction’s end, targeting 2,805.98.
Upcoming Catalysts: CPI Data and ETF Flows
Wednesday’s US CPI report sets the next critical inflection point. Markets anticipate a 0.6% monthly headline increase and 0.2% core inflation. A hotter-than-expected core reading could reignite expectations for additional Federal Reserve tightening, driving yields and the Dollar higher and pressuring cryptocurrencies. A softer print might offset this, aiding Bitcoin and Ether’s rebound.
Technical confirmation remains tied to price action. Bitcoin must clear 84,245.88, while Ether needs to break 2,576.30. Until these barriers fall, the corrections remain unresolved, leaving room for further downside. The interplay between technical signals and spot demand—particularly ETF flows—will determine if recoveries gain lasting momentum or falter under renewed selling pressure.
Two liquidation waves have not overturned the October support levels, reinforcing the view that Bitcoin and Ether are undergoing corrections rather than confirming broader bearish reversals. However, the inability to clear resistance means these corrections remain open-ended. Whether Wednesday’s CPI data and subsequent ETF flow reports provide the necessary sustenance for a durable rally is now pivotal.
Key Takeaways
- Bitcoin and Ether each defended support twice in under a week—Bitcoin around 80,365–80,953 and Ether near 2,407—indicating liquidation-driven selling has not triggered systemic collapse.
- Approximately $974 million in liquidations and $484.9 million in Bitcoin ETF outflows intensified the first wave, but 30-day ETF flows remain net positive at +$1.76 billion, suggesting short-term stress rather than structural exits.
- Bitcoin’s immediate bias remains bearish below 84,245.88, with a break lower risking a test of the 75,026–76,040 support zone; a breach above 84,245.88 would revive bullish momentum toward 87,354.33.
- Ether’s near-term bias stays bearish below 2,576.30, with a drop to 2,310.94 possible if 2,407 fails. A clear break above 2,576.30 would signal the correction’s end, targeting 2,805.98.
- Wednesday’s US CPI and upcoming ETF flow data are decisive catalysts. Their outcomes will clarify whether spot demand and technical upgrades can fuel a sustained rebound.


