







Brent crude opened the week with a significant upward gap, breaching the key $90 psychological threshold as markets responded to escalating developments in the U.S.-Iran conflict. Reports of U.S. fatalities, a strike on a Kuwaiti energy facility, Iran’s declaration that the ceasefire had collapsed, and renewed speculation about the closure of the Strait of Hormuz have compounded concerns over near-term supply stability. Despite the heightened geopolitical backdrop and the technical breakout, trading momentum in Asian markets has remained relatively subdued.
Why hasn’t Brent surged further?
The lack of more aggressive price action reflects that much of the week’s escalation had already been priced in. Brent surged over 17% last week—their strongest weekly gain since April—as markets incrementally adjusted to heightened risks of supply disruptions. The latest headlines largely confirmed existing fears rather than introducing new shocks. Investors appear to maintain a base case of a potential Strait of Hormuz reopening, tempering immediate buying urgency.
What could drive Brent toward $100?
The trajectory hinges on time rather than newsflow. Following June’s interim agreement that eased sanctions and reopened the strait, Iran was exporting an estimated 2.2 million barrels daily. With the blockade restored, this supply lies dormant. Prolonged shipping disruptions increase the probability of markets shifting from viewing the crisis as a negotiating tactic to interpreting it as a genuine physical supply constraint. Under such conditions, Brent could rapidly approach $100 as traders price tighter global balances rather than geopolitical risk alone.
How does this crisis differ from March’s escalation?
Unlike the March-April escalation, when releases from strategic petroleum reserves cushioned supply fears, today’s market offers far fewer buffers. Estimates suggest meaningful physical shortages could emerge within ten weeks of ongoing disruptions. This would force consuming nations, particularly in Asia, to compete for scarce barrels, altering pricing dynamics from a geopolitical risk premium to one driven by actual supply deficits. In this environment, retesting this year’s highs is no longer an outlier scenario.
What do technical indicators signal?
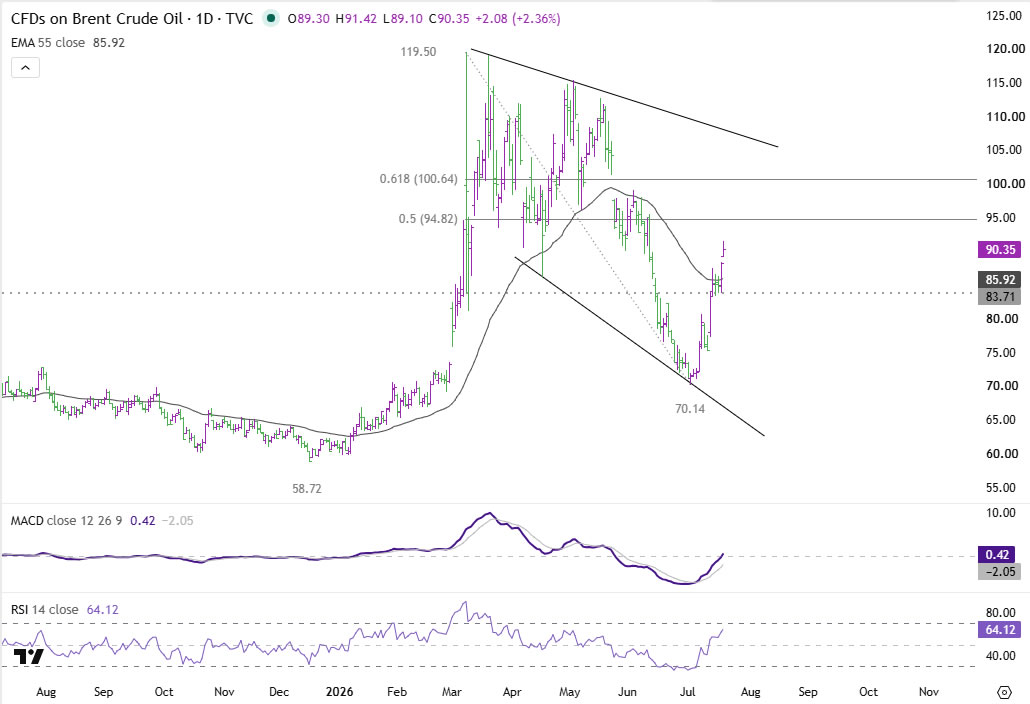
Technically, Brent’s decisive move above the 38.2% retracement level of 119.50 to 70.14 at $89.00 reinforces a bullish trend reversal, rather than a mere corrective bounce. The prior decline from 119.50 to 70.14 exhibited a well-defined three-wave corrective structure, suggesting the long-term uptrend remains intact. As long as support at 83.71 holds, further gains are favored. The next critical resistance lies around $95, where the 50% retracement ($94.82) converges with the upper boundary of the near-term rising channel.
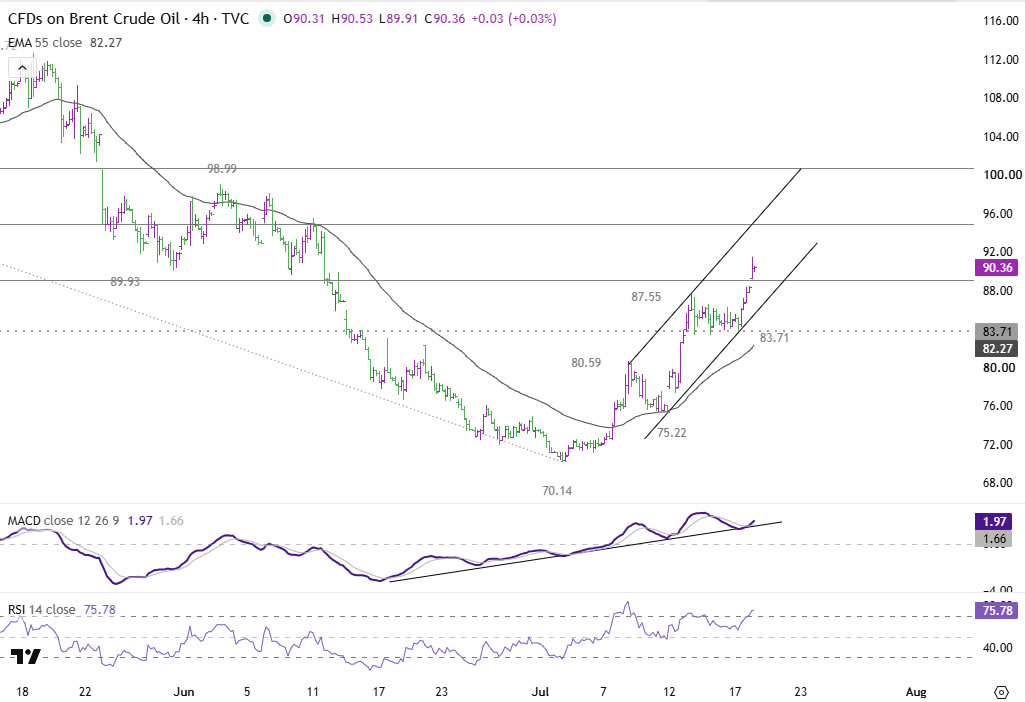

A break above this resistance could signal a shift toward prolonged supply disruption, opening the path to the 61.8% retracement at $100.64 and potentially toward the March high of $119.50.

Also Read
- AUD/USD Rises to Four‑Week High, Awaiting Australian Jobs Report to Confirm Trend
- XRP Surges 4% as Traders Monitor Triangle Breakout Targeting $1.35
- BTC/USD Forex Signal – July 21: Bitcoin ETF Inflows Keep Climbing
- Chainlink Exchange Reserves Decline 12% as Institutional Adoption Accelerates with DTCC Partnership


