



-(1).jpeg?w=1024&resize=1024,1024&ssl=1 "Riaz Defiant: Pakistan Women’s Asia Cup Hopes Alive Despite Record 55 All Out vs India")






[Beyond Complexity: Why Sophisticated Bitcoin Forecasting Often Chases Market Noise]
Bitcoin price forecasting has accumulated an unusually colorful collection of methods.
Basic scarcity models convert the halving schedule into a projected price, while traditional on‑chain indicators translate address or transaction activity into valuation metrics.
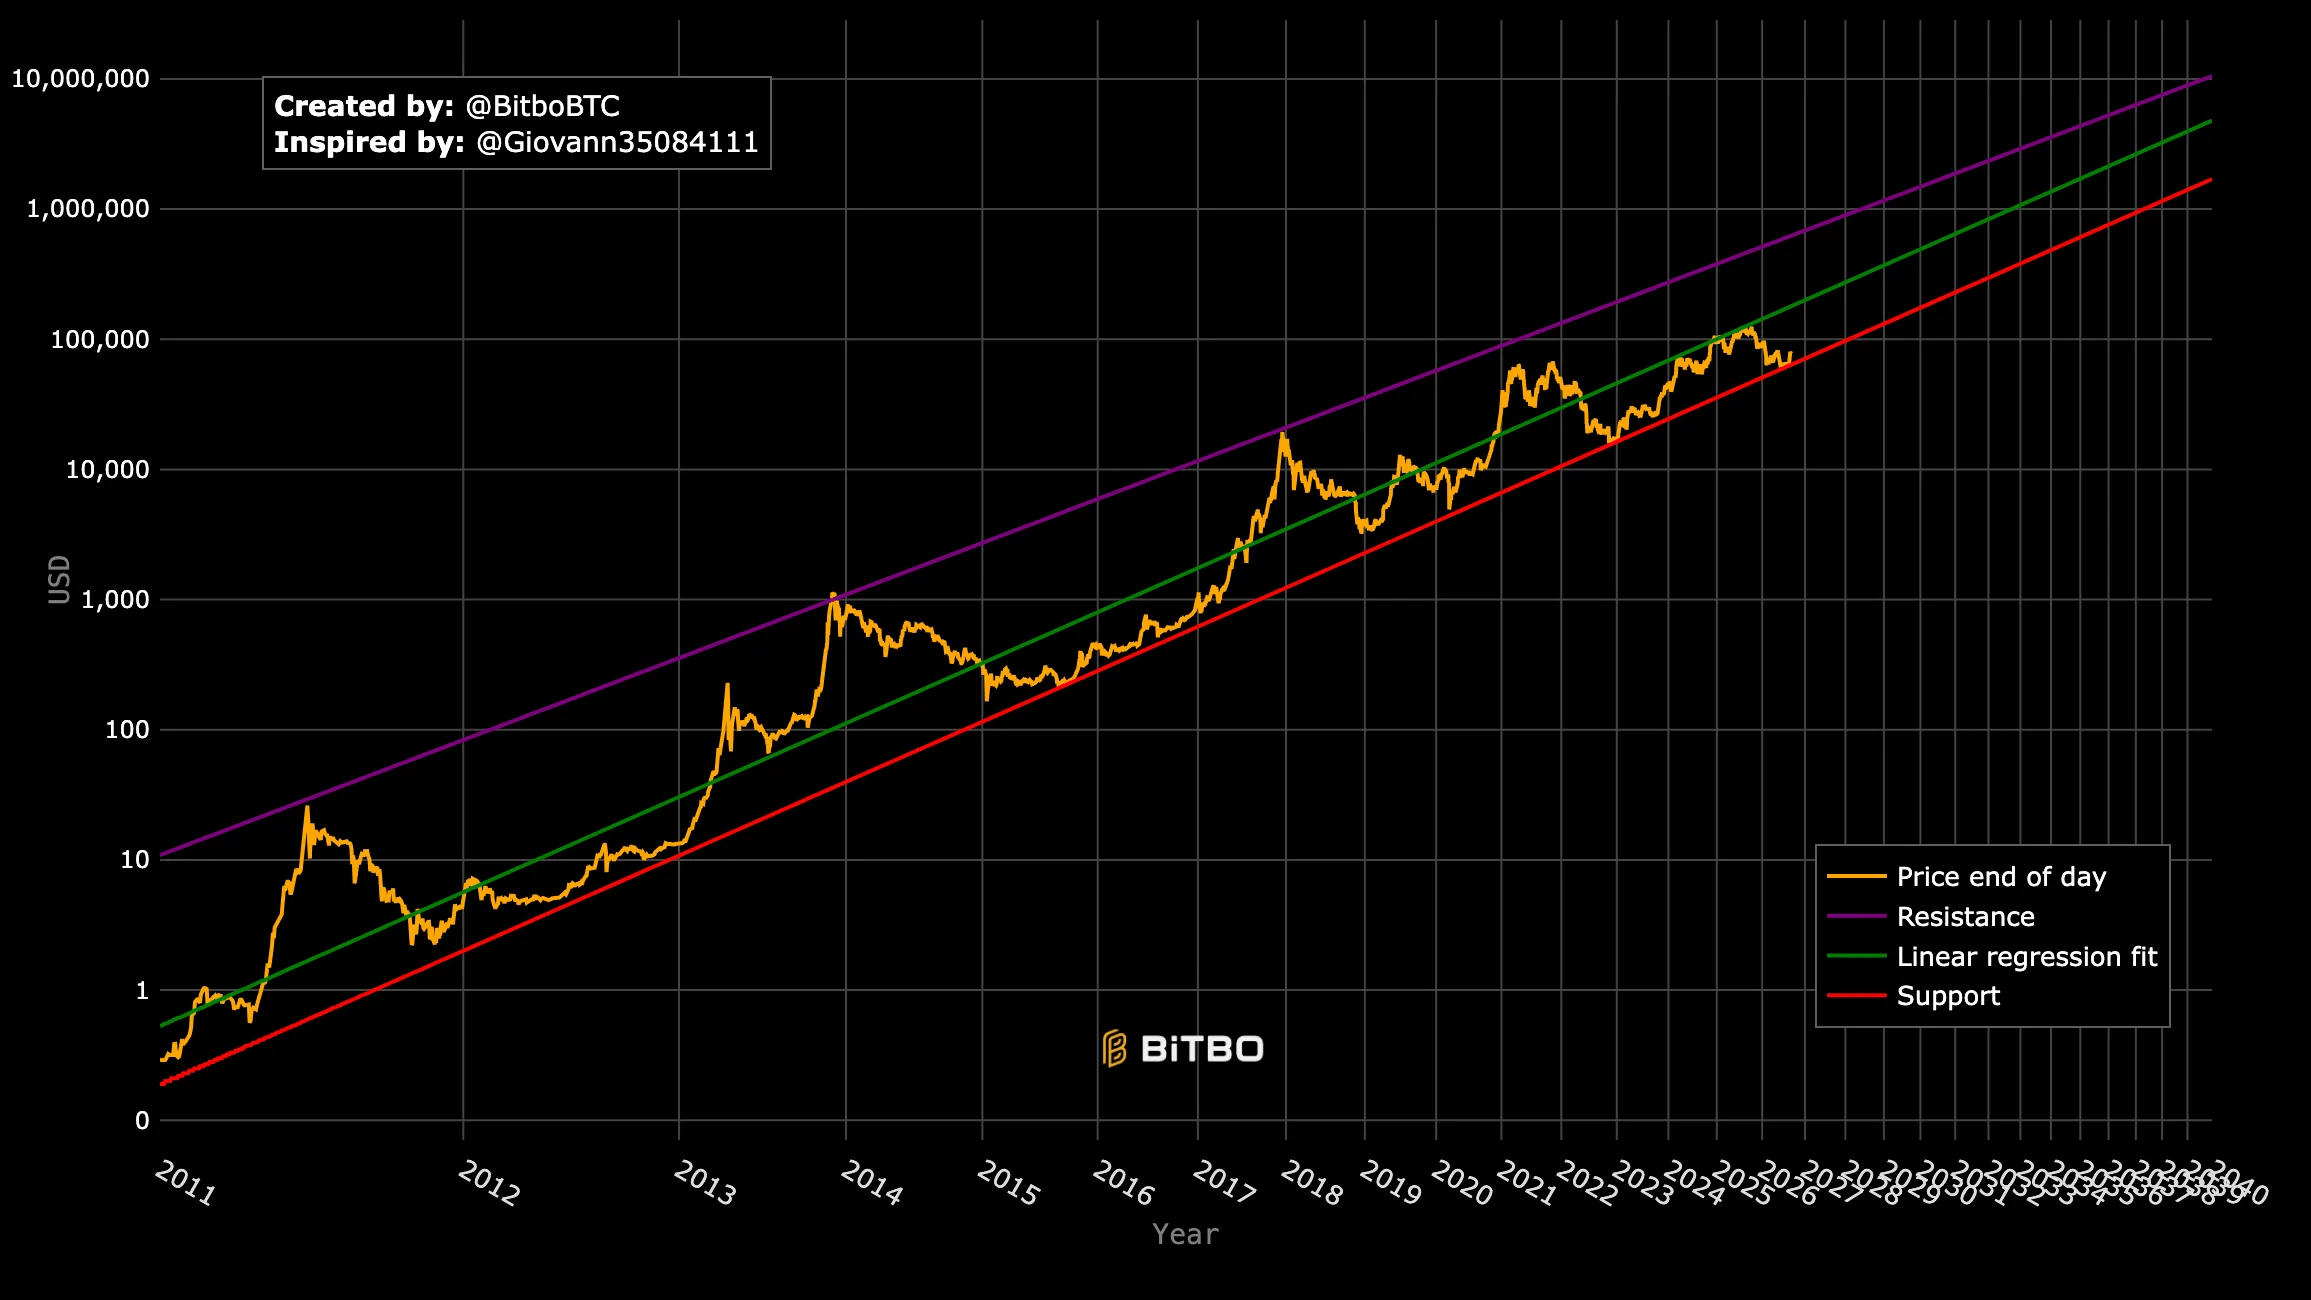
The heavily contested power‑law charts draw an ascending corridor through Bitcoin’s historical trajectory, and machine‑learning systems ingest market and macroeconomic data into intricate algorithms.
Every approach enters the price‑prediction contest against a simple but effective baseline: naive forecasts that rely solely on present information. A price forecast uses today’s price; a return forecast uses zero; a directional forecast employs a random walk.
Much of the academic literature has struggled to surpass this straightforward benchmark once a model departs from the testing period in which it was initially developed.
A May 2026 preprint reviewing Bitcoin prediction research by Carlos Baquero of the University of Porto concluded soberly: across the peer‑reviewed literature, no model had demonstrated durable superiority over the appropriate naive benchmark at horizons of one to six months across multiple market regimes.
The corpus contains hundreds of papers, yet Baquero narrowed his analysis to twenty‑three based on methodology rigor, impact, and authentic out‑of‑sample validation. Notably, the review itself remains pending peer review—an essential caveat given that its core argument stresses the need for stricter evaluation criteria.
Short‑horizon volume analysis and daily return modeling carve out a distinct domain that delivers genuine predictive value. Public forums frequently meld these short‑term efforts with longer‑term price predictions, though each objective demands a fundamentally different lens.
A formula describing Bitcoin’s historical path reveals little insight into tomorrow’s movement, whereas a daily direction model provides scant insight into a price point six months ahead.
The Simplest Rival in Finance
Naive forecasting thrives because financial prices exhibit persistence: a model that predicts $100,100 tomorrow when Bitcoin trades at $100,000 today incurs a negligible percentage error even without learning meaningful directional signals.
Consider the baseline: today’s price proved nearly accurate, and attributing this credit to a sophisticated model merely grants it information the market had already supplied.
The benchmark intensifies as horizons expand, since Bitcoin can surge violently within weeks, allowing more time for predictive edge to emerge, while learned relationships degrade as market dynamics shift.
Models calibrated to the retail‑driven 2017 cycle falter against the 2021 market structure, and the launch of spot ETFs in 2024 opened additional channels for capital flow and price discovery.
This challenge—known as non‑stationarity—emerges when variable relationships drift too quickly for past observations to forecast the future.
Bitcoin’s user base, liquidity, regulatory environment, and trading participants have all evolved. A model capturing dynamics in one epoch can fail entirely when the market transitions to yet another, as the underlying structural relationships change.
Francesco Puoti, Fabrizio Pittorino, and Manuel Roveri arrived at a parallel conclusion in a study comparing statistical, machine‑learning, and deep‑learning forecasts across twelve approaches applied to five major cryptocurrencies at one‑day, seven‑day, and 30‑day horizons.
Simple naive models consistently outperformed ARIMA, Prophet, random forests, XGBoost, LSTM networks, and N‑BEEs on these assessments.
The pattern suggests that available information quality outweighs architectural complexity. Sophisticated algorithms excel when stable patterns persist, but they can retroactively memorize transient market noise when such patterns are absent.
Bitcoin generates massive datasets, yet the number of distinct market cycles is comparatively limited. Millions of minute bars repeat observations from identical past events—namely the 2018 bear market or the 2020 liquidity shock—limiting the diversity of learning opportunities.
When Backtests Become Crystal Balls
Many Bitcoin models appear strongest after their creators have observed the entire historical dataset used for construction. Researchers experiment with variables, lookback windows, origin dates, and architectures before disclosing final configurations.
Potential winners may exploit durable insights, but they can equally seize upon a fortuitous coincidence—a phenomenon known as backtest overfitting.
David Bailey and collaborators formalized this risk regarding the likelihood that exhaustive model variation favors luckful historical coincidences. Increasing multivariate searches raises the probability of uncovering an excellent retrospective match purely by chance. Isolating the victor and showcasing its performance obscures the extensive trail of unsuccessful trials required.
“A single temporal split offers minimal safeguard, as a researcher might train through 2020 and evaluate the model in 2021, projecting apparent out‑of‑sample performance that derives largely from one bull market.”
Walk‑forward evaluation is preferable because the model continuously retrains on prior data to forecast subsequent intervals. Multiple non‑overlapping holdout windows demand that the same method confront successive bull runs, crashes, sideways trajectories, and variant liquidity regimes.
Among the peer‑reviewed studies Baquero analyzed, none evaluated identical methodologies across several disjoint holdout segments spanning diverse regimes. Leading works utilized rolling or walk‑forward designs over one continuous out‑of‑sample span.
New Bitcoin power law chart turns $124k into the ETF-era battleground
Despite contributions showing real explanatory power, aggregate errors can mask hidden weaknesses in specific market phases.
Information leakage can generate spurious confidence because a feature derived from future data presents the model with glimpse of answers it cannot be tested against. Overlapping return windows similarly permit cross‑contamination, carrying forward observations across training boundaries.
Such subtlety sometimes evades rigorous peer review, particularly when elaborate architectures insert numerous transformations between raw inputs and reported forecasts.
Signal Before the Noise.
Start your day with crypto developments shaping markets, curated by CryptoSlate’s editorial team.
One email. Comprehensive insight only.
Whoops, looks like there was a problem. Please try again.
You are subscribed. Your upcoming Daily Brief is on its way.
The performance metric can inflate accuracy claims when reporting near‑perfect price alignment—a baseline challenge for any persistent series.
Traders prioritize directionality and move magnitude, alongside execution costs. A model forecasting $100,500 despite Bitcoin shifting from $100,000 to $99,500 exhibits marginal error but takes an incorrect action.
Models That Outlive Their Own Forests
Bitcoin’s most renowned valuation frameworks endure because they distill intricate behavior into intuitive logic.
Stock‑to‑flow theory posits that scarcity drives value, with each halving diluting new supply relative to the existing pool.
Metcalfe‑style propositions predict heightened network worth as user adoption grows.
The power law explains Bitcoin’s extended history through a stable mathematical link between price and time.
While each concept harbors plausible economic intuition, forecasting credibility hinges on whether fitted relationships persist under new data and eclipse simpler explanations.
Alexander Shelton’s 2024 peer‑reviewed examination of Bitcoin return prediction revealed that stock‑to‑flow and Metcalfe variables explained in‑sample returns using robustly though offering limited or zero predictive utility out of sample.
Introducing time into stock‑to‑flow regressions erodes its statistical potency. Bitcoin’s supply ratio escalates on a preset cadence, while price ascended for decades, rendering the paired series appear intertwined economically.
Market downturns materialized years earlier than formally documented in comprehensive reviews. The stock‑to‑flow projection broke off track as the asset fell beneath its anticipated trajectory for prolonged periods.
“Persistent deviation can be absorbed by redefining outputs as long‑term value or cycle averages, though each reshaping complicates transparent price attribution.”
Figure captions display larger graphical artifacts reflecting these analytical tensions.


The Formulaic Models That Persist
The most celebrated valuation frameworks dominate because they simplify complex assets into digestible narratives.
For instance, stock‑to‑flow suggests scarcity anchors value, with halvings incrementally shrinking the circulating supply relative to total holdings.
Metcalfe’s principle argues network worth amplifies as the user base broadens.
A power‑law hypothesis holds that Bitcoin’s historic price trajectory conforms to a mathematically stable relationship between duration and price.
Critically, each concept blends plausible economic reasoning with empirical outcomes. Ultimately, forecast reliability depends on whether these patterns survive fresh data and whether elementary interpretations capture equivalent phenomena.
Alexander Shelton’s 2024 peer‑reviewed audit of Bitcoin return prediction showed that stock‑to‑flow and Metcalfe variables accounted for in‑sample returns but contributed minimally—or not at all—to out‑of‑sample performance.
When time dynamics entered stock‑to‑flow regressions, their inferred strength waned. Because Bitcoin’s supply grows on a fixed calendar rhythm while price climbs concomitantly throughout much of its history, the pairing appears statistically linked.
Earlier signs of market stress emerged long before explicit documentation in formal reviews. The stock‑to‑flow projection detached from Bitcoin’s price trend after the asset declined well beneath expectations for multiyear stretches.
“Absorbing persistent divergence through resetting definitions sidesteps direct value attribution, requiring recasting long‑term projections to quantify residual wealth.”
`
Also Read
- Azerbaijani Manat Weekly Market Review: Stability Against USD, Euro, Ruble, and Lira
- Trezor Data Breach Expands to Include Over 67,000 Additional Customers After Shipping Logs Were Retained Past Deletion Assurance
- Decentralized Governance Faces Tension Between Automated Rules and Emergency Veto Powers
- Ancient Bitcoin Wallet That Turned $120 Into $3 Million Wakes Up


