







Gold maintained its position above the $4,050 per ounce mark on Wednesday, building on gains from the previous two trading sessions. Investors remain focused on the Federal Reserve’s upcoming interest rate decision, while simultaneously evaluating the implications of the recent Israeli elections on the ongoing Middle East conflict.
While the Federal Reserve is widely anticipated to hold interest rates steady, market attention will center on any signals pointing toward a potential rate increase in December. Should the central bank maintain a hawkish posture, it could exert renewed downward pressure on gold prices.
In a parallel development, the Reserve Bank of New Zealand unexpectedly held its interest rate steady, defying widespread expectations of another hike. This decision highlights a more cautious approach by the regulator toward further monetary tightening.
The geopolitical landscape continues to be a key driver for financial markets. Oil prices remain highly volatile following the tense elections in Israel, as the outcome could significantly influence the trajectory of the regional conflict. Over the past year, gold has faced persistent pressure because escalating regional tensions have amplified inflationary risks and reinforced expectations of higher interest rates. This environment has diminished the appeal of the non-yielding metal.
Technical Analysis
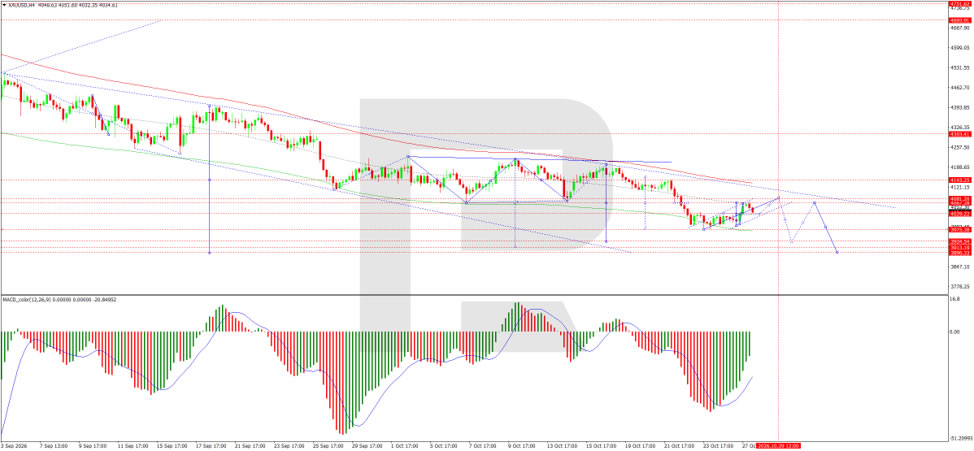

On the four-hour (H4) XAU/USD chart, gold continues to respect a downward trend. The market completed a corrective leg higher to the $4,064 level before forming a fresh wave of selling that pushed prices down to $4,034. In the short term, a minor recovery toward the resistance level at $4,082 cannot be ruled out, potentially followed by a retest of this broken support level from below. Once this correction is complete, the decline is expected to resume toward support at $3,975. A decisive break below this support could open the path toward the primary target of $3,931, with the potential to extend further to $3,913. The MACD indicator confirms the prevailing bearish trend; although the signal line remains below zero, it is beginning to turn upward. This suggests a temporary easing of selling pressure and allows for a brief corrective phase before the primary downward move resumes.
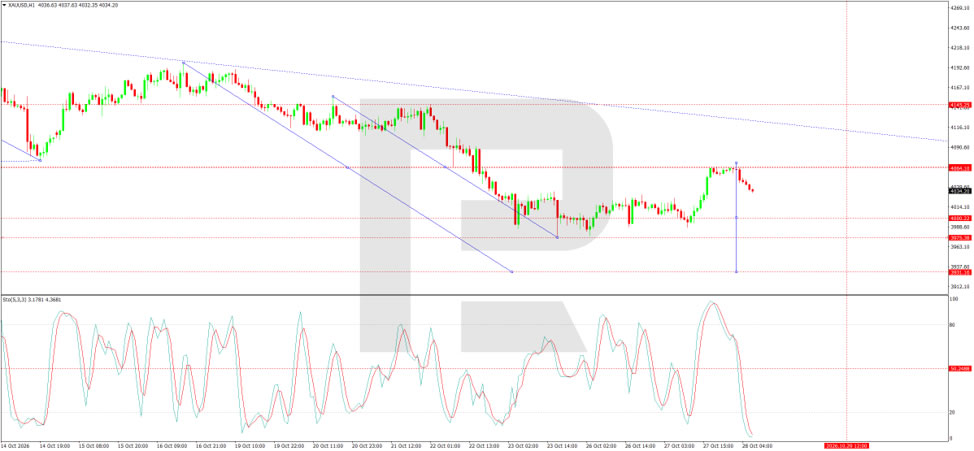
On the hourly (H1) XAU/USD chart, gold completed an upward correction around the $4,064 area and initiated a new wave of downward momentum. With the price firmly positioned below key resistance, the likelihood of further decline remains intact. The immediate target is set at $4,029. A break below this level would pave the way for a move toward support at $4,000, followed by $3,975 and $3,931. The Stochastic oscillator is currently situated in the oversold zone below the 20 level, confirming short-term market weakness while simultaneously increasing the probability of a local corrective rebound.
The primary scenario for today remains centered on a decline in gold, likely following a retest of the $4,064–$4,082 resistance zone from below. However, a decisive close above $4,082 would invalidate the bearish outlook and set the stage for a deeper correction toward $4,145. Until such a bullish signal materializes, the trading strategy should prioritize selling into local upward market rallies.
Conclusion
Gold is currently pausing ahead of the Federal Reserve’s interest rate decision, with market participants closely monitoring any guidance regarding a potential December rate hike. Although the Fed is expected to maintain current rates, a surprisingly hawkish tone could renew downward pressure on the precious metal. Meanwhile, the Reserve Bank of New Zealand’s unexpected decision to hold rates steady has reinforced the theme of cautious central bank policy, while ongoing geopolitical uncertainty following Israel’s elections continues to keep oil prices highly volatile. Gold remains trapped between safe-haven interest and the headwinds of elevated inflation and expectations of tighter monetary policy. Technically, the downward trend remains intact, with key resistance seen at $4,082 and downside targets at $4,029, $4,000, and $3,931. While a short-term corrective bounce is possible due to oversold conditions, the broader outlook remains bearish unless gold prices can close decisively above the $4,082 resistance level.
Also Read
- Bitcoin could reach $1.6 million by 2036, but 82% of the forecast rests on one bet
- Exchange Rates: US Dollar Selling Rate At Rs278.54, Buying Rate At Rs275.54 – UrduPoint
- Fed’s Split Rate Decision Tightens Pressure on Bitcoin’s Market Recovery Ahead of December Hike The Federal Reserve kept its target range at 3.75%‑4% during its Oct. 28 meeting, a 10‑2 vote. Governor Lisa Cook and Cleveland Fed President Beth Hammack dissented, urging an immediate 25‑basis‑point increase. Market analysts quoted odds of roughly an 83‑88% chance of a December hiking decision, as the market had previously priced in a hold. Bitcoin fell to $80,500 before rallying above $81,000, approaching the approximately $81,500 aggregate cost basis of U.S. spot Bitcoin ETFs, per Glassnode estimates. The hold and Warsh’s message The committee affirmed robust growth and reaffirmed its commitment to bring inflation back to the 2% target. In his press conference, Chair Kevin Warsh noted that credit conditions had tightened, spreads had widened, and higher rates were impacting technology investment, notably AI. Warsh refrained from labeling overall financial conditions as tight, indicating the Fed is prepared to endure additional market stress before adjusting policy. The 10‑year Treasury yield stood at about 5.04% on the decision day, while the two‑year was near 4.78%; the University of Michigan’s final October sentiment index recorded 48. Fabian Dori, chief investment officer at Sygnum Bank, references this week’s Magnificent Seven earnings, which could determine whether AI capital expenditures are turning into revenue, while highlighting liquidity and financial conditions as key drivers for December policy. He notes that the easing of the Strait of Hormuz situation following the midterms could potentially lower oil prices, reduce inflation pressure, and ease rate expectations. The $81,500 test for Bitcoin Glassnode’s Oct. 28 report characterized the market as one where long‑term holders control roughly 4 million BTC, purchased between $85,000 and $118,000, reflecting sell pressure as prices recover. These coins remain distinct from sell orders, as holders who recoup breakeven may or may not liquidate. Approximately 4.3% of the supply recently moved between $84,000 and $85,000, a shift largely attributed to an internal wallet transfer in November 2025. Glassnode’s supply‑price threads show Bitcoin repeatedly meeting resistance around the $84,000 to $85,000 range. Since the Oct. 24 correction, roughly $3.4 million of Binance bids remain at $80,000. The biggest accumulation cluster sits between $78,000 and $79,000, with about $42 million—up from around $24 million in mid‑October. The True Market Mean is near $77,900, while short‑term holder cost basis hovers around $75,800. Reluctant sellers, hesitant buyers On Oct. 22, on‑chain data revealed approximately $3.7 billion of realized profit and $1.4 billion of realized loss, with Glassnode attributing the surge primarily to wallet‑to‑wallet transfers among related entities. Entity‑adjusted profit taking approached $260 million per day, roughly half its September maximum. The biggest daily net realized loss around Oct. 24 was about $27 million, compared with about $630 million at the August trough, while wallets holding 100 to 1,000 BTC emerged as the most persistent accumulators in October. The 30‑day realized volatility sits near 25%, well under the 95th percentile of readings since 2015. The trend indicates sellers growing reluctant while buyers re‑entering cautiously. Farside Investors report that spot Bitcoin ETF net flows were negative $487.2 million between Oct. 22 and Oct. 27. How much is priced A simplified model treats December as a hold or a single 25‑basis‑point increase. At an 87% probability, roughly 21.75 basis points of the hike are already embedded in expectations. A revision to 50% would eliminate roughly 9.25 basis points, whereas a shift to 95% would add about 2 basis points. A more significant market impact may stem from upcoming revisions to the 2027 rate path, as reflected in the December projections. Brendan Ma, head of investment strategy at the Arbitrum Foundation, views the hold with two dissenting calls—supporting a live December decision with the majority of effect already embedded. He notes that tokenized equities have risen roughly 12% in the past month, while tokenized Treasuries have contracted despite the 10‑year yield hovering near 5%. “Capital on-chain is moving to where it can be used, not just where it’s paid to wait.” RWA.xyz data indicate that the distributed value of tokenized stocks has risen approximately 17.8% over the past 30 days. Where Bitcoin goes from here Should PCE, GDP, and the November 6 payrolls cool inflation expectations, yields ease, and ETF inflows resume, Bitcoin could climb past $81,500 and sustain closes above $85,000. The next key level is $87,000‑$87,500, where overhang supply increases. Given the 30‑day volatility near 25%, the one‑standard‑deviation range spans roughly $74,100 to $87,900 through Dec. 9 starting from $81,000. Overshooting inflation could lift Treasury yields, trigger ETF withdrawals, and drive the market lower, potentially below the $78,000‑$79,000 bid range and near the $77,900 True Market Mean. A downturn would gain prominence if entity‑adjusted realized losses widened while redemptions continued. Bitcoin’s selling remains subdued while buying pressure is thin, and the upcoming PCE, jobs, and CPI releases will reveal which trend prevails as the Dec. 8‑9 meeting approaches.
- Pakistan Announces Forward Cover Exchange Rates for Oct 29


