






TL;DR: Gold has slipped to a one-year low ahead of the FOMC minutes, yet a December hike is already priced in. The real question is how much further the Federal Reserve will tighten from here. Neither rising yields nor a firmer Dollar fully accounts for the size of the selloff, which points to positioning and widespread commodity liquidation as likely amplifiers, with critical support converging near 3,600–3,637.
Why Gold Is Sliding to a One-Year Low Ahead of the FOMC Minutes
Gold deepened its sharp selloff on Wednesday, dropping to its lowest level in over a year as investors braced for the release of minutes from the Federal Reserve’s October 27–28 meeting. Bullion was hovering near 3,770 at 09:00 GMT, down more than 2% on the day and 6.5% over the past week. The wider environment stays challenging for the metal, with the Dollar close to a 19-month high and markets pricing in additional Fed tightening. Yet the December rate increase itself is effectively a done deal, with CME FedWatch placing a 96.7% probability on a 25bps hike. The far more meaningful uncertainty lies in how aggressively the Fed may have to raise rates once December passes. Notably, gold’s latest drop is far larger than the Dollar’s gain, and Treasury yields actually edged lower on the day, indicating that shifting rate expectations alone cannot explain the selloff.
A December Hike Looks Locked In, but the Focus Is on Further Tightening
The Fed left its benchmark rate unchanged at 3.75–4.00% in October, with the decision clearing by a 10–2 margin. Governors Lisa Cook and Beth Hammack both dissented in favor of a 25bps increase. The accompanying statement characterized economic activity as growing at a robust pace while inflation stayed elevated, reinforcing the view that policy would need to tighten further.
In the weeks since, market pricing has swung firmly toward a conventional December hike. CME FedWatch data at 07:53 GMT put the odds of a 25bps increase on December 9 at 96.7%, up from 95.5% on November 16 and 87.3% on November 11. Over that stretch, the probability of a larger 50bps move collapsed from 12.7% to a mere 3.3%.
- 25bps hike on December 9: 87.3% (Nov 11), 95.5% (Nov 16), 96.7% (today, 07:53 GMT)
- 50bps hike on December 9: 12.7% falling to 3.3%
The fading likelihood of an outsized hike does not signal cooling expectations for tightening. Rather, investors have grown more certain about the size of the imminent increase, and the debate has shifted toward how many additional hikes might follow.
As of the January 27 meeting, futures pricing implies roughly a 72% chance of another increase beyond December. Looking further out, the expected policy path is consistent with about 2.7 quarter-point hikes by April 2027 and 3.1 by November 2027, measured from the current range.
Recent Fed remarks have underscored the case for more tightening, though officials diverge on how forcefully policy should respond. St. Louis Fed President Alberto Musalem has suggested several rate increases may be needed before spring 2027, with his view of the appropriate rate level potentially exceeding current market expectations. Cleveland Fed President Beth Hammack has likewise contended that financial conditions are not yet restrictive enough, while New York Fed President John Williams has backed further increases but cautioned against overly aggressive action.
The minutes, due at 19:00 GMT, could shed more light on how widely officials backed tightening in October, whether larger hikes were genuinely on the table, and how policymakers judged the eventual level of interest rates.
That said, the document is inherently backward-looking. It predates October’s inflation report and the most recent wave of Fed speeches, which limits its potential to catch investors off guard unless it exposes a more hawkish or more divided debate than markets currently assume.
Gold’s Drop Outpaces the Moves in Yields and the Dollar
Gold’s recent softness broadly tracks the repricing of Fed policy. Higher rates lift the opportunity cost of holding non-yielding bullion, while a stronger Dollar adds to the strain by making gold pricier for holders of other currencies.
Across the past week, US two-year and ten-year Treasury yields each climbed by roughly 22–23bps, while the Dollar Index advanced 1.57%. Together, these moves offer a plausible macroeconomic explanation for a portion of gold’s 6.51% weekly decline.
That relationship, however, looks far less persuasive in Wednesday’s session.
At 09:00 GMT, gold was down about 2.06%, against a slim 0.22% gain in the DXY. More tellingly, the US two-year yield had eased to around 4.791% and the ten-year to 5.093%, each down roughly 1.5bps on the day.
- Past week: gold −6.51%; US two-year and ten-year yields +22–23bps; Dollar Index +1.57%
- Wednesday, 09:00 GMT: gold −2.06%; DXY +0.22%; US two-year yield about 4.791% and ten-year about 5.093% (both roughly −1.5bps)
The gap is just as apparent over a longer stretch. Gold has shed 9.46% over the past month, while the ten-year yield is only around 3bps higher over that same span. Although the benchmark yield has recovered roughly 28bps from its early-November trough, that rebound falls well short of explaining the scale of bullion’s retreat.
The Fed’s tightening trajectory clearly remains a meaningful source of pressure, yet the latest decline looks too steep to pin solely on rising yields and Dollar strength. Other forces may be magnifying the move.
Widespread Commodity Selling Raises Positioning Questions
The weakness stretches well beyond gold. Copper was down 4.15% at the same snapshot, while platinum and silver had slid 3.45% and 3.39%, respectively. Crude oil was also under pressure, with WTI off 3.36% and Brent lower by 2.13%. Iron ore, up 0.18%, was a notable outlier.
- Copper: −4.15%; platinum: −3.45%; silver: −3.39%
- WTI: −3.36%; Brent: −2.13%; iron ore: +0.18%
Silver’s steeper drop lifted the gold/silver ratio to 82.388, reinforcing the impression of broad-based selling across precious metals rather than an isolated move in bullion.
Reuters reported analysts suggesting that investors were trimming positions and offloading gold as a liquid asset. The concurrent declines across metals and energy fit that reading, particularly since gold kept sliding even as Treasury yields eased.
Still, the evidence points to positioning or liquidity pressure as a plausible contributor, not a proven cause of the selloff.
Financial markets are hardly showing a uniform dash from risk. South Korea’s KOSPI rose nearly 2%, Japan’s Nikkei edged modestly higher, and European equities moved within relatively tight ranges. Bitcoin and Ether, meanwhile, slipped less than 1% each.
In currencies, the Yen outperformed its major peers, while the Dollar’s gains were concentrated against several currencies rather than broad-based.
This uneven backdrop suggests the selling pressure is concentrated within commodities rather than reflecting indiscriminate liquidation across asset classes.
The distinction matters for gold’s next move. Should bullion keep falling alongside higher Treasury yields and a more hawkish repricing of the Fed’s rate path, the monetary-policy explanation would gain ground. Should gold stay under pressure without meaningful shifts in yields or Fed pricing, positioning and broader commodity-market weakness would remain the more credible drivers.
The FOMC Minutes Could Test the Selloff’s Real Drivers
With a December 25bps hike already priced at 96.7%, the minutes may do little to alter expectations for the next meeting. Their greater significance lies in whether they reshape expectations for the pace and scale of tightening through 2027.
Signs of broad backing for consecutive hikes, concern over stubborn inflation, or discussion of a higher terminal rate could add to the pressure on gold if Treasury yields react in kind.
By contrast, indications that officials remain split over how much additional restraint is warranted could soften expectations further out the curve, potentially giving bullion some relief.
The response of the US two-year yield and January–March Fed pricing will therefore be particularly telling. A gold decline accompanied by further hawkish repricing would point to monetary policy as the dominant force. Continued gold weakness without a matching rates response would keep the positioning explanation more relevant.
ActionForex Technical View: Gold Finds Key Support Near 3,600–3,637
Gold’s downtrend remains intact, with downside momentum building as reflected in the four-hour MACD. The latest break to new lows has also left the metal well beneath its declining 55-period EMA, keeping the near-term technical picture bearish.
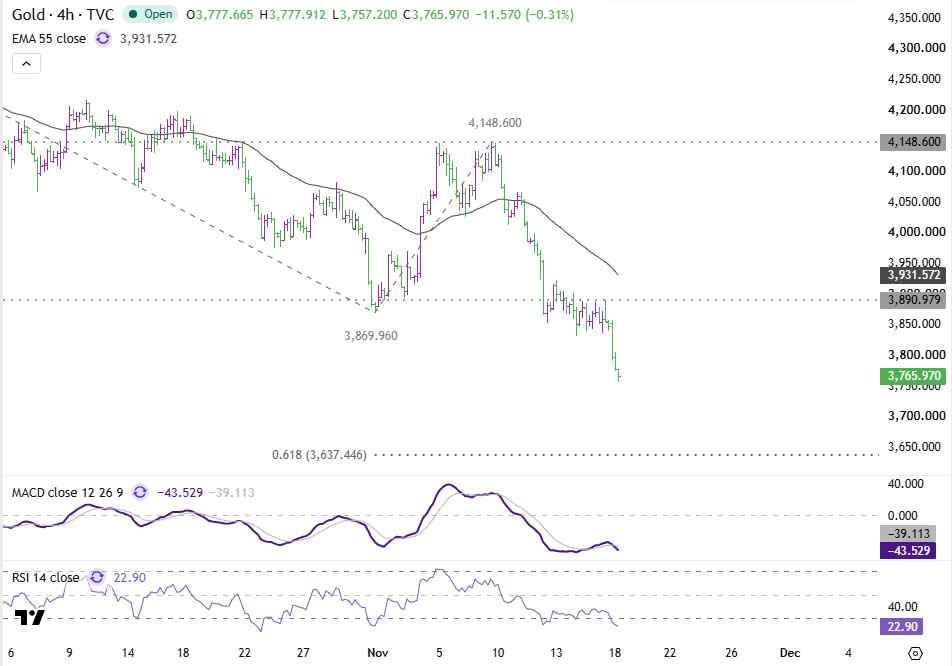

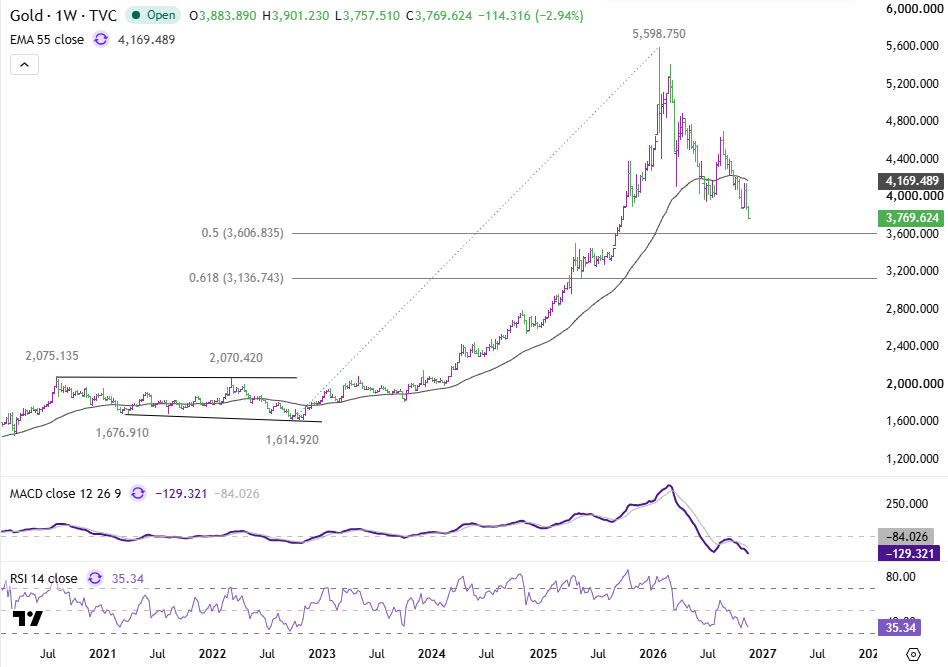
Gold is now nearing a key target zone where multiple technical levels line up. The first is the 61.8% projection of the decline from 4,697.07 to 3,869.96, measured from 4,148.60, at 3,637.44. Just below sits the longer-term 50% retracement of the advance from 1,614.92 to 5,598.75 at 3,606.83, followed closely by the psychological 3,600 mark.
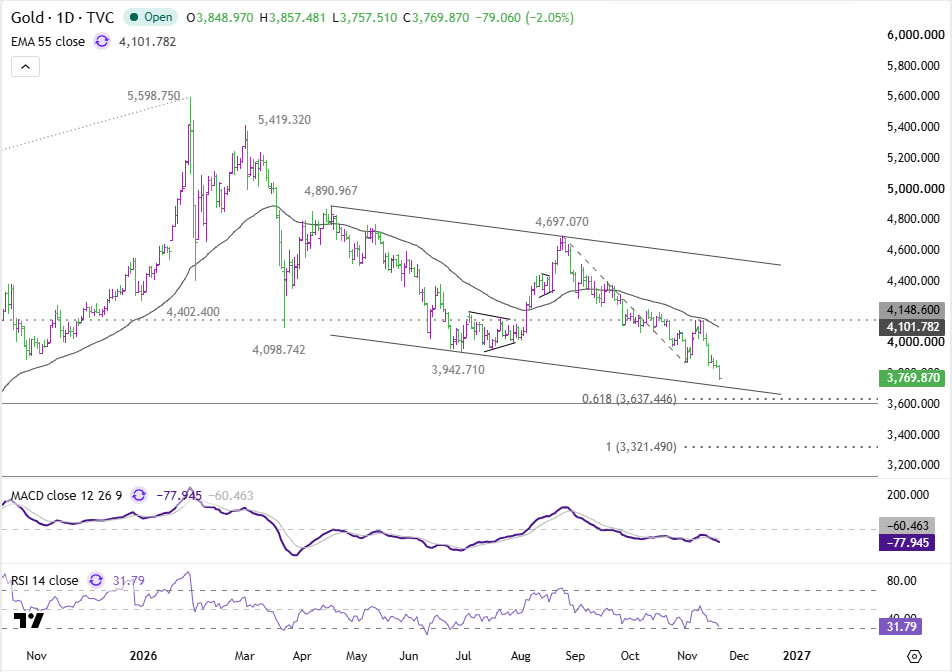

The clustering of these levels could draw support and briefly stall the decline, especially with the four-hour RSI already flashing oversold. Even so, the force of the current downside momentum cautions against assuming a durable reversal is taking shape.
A move above 3,890.97 resistance would signal consolidation, but the broader outlook stays bearish so long as 4,148.60 holds.
If gold breaks decisively below 3,600, the next downside objective would be the 100% projection of 4,697.07 to 3,869.96 from 4,148.60, at 3,321.49.

Key Takeaways
- Gold slid to about 3,770, its lowest in more than a year, down over 2% on the day and 6.5% on the week, ahead of the FOMC minutes at 19:00 GMT.
- The December 25bps hike is priced at 96.7%, so the bigger question is how far the Fed raises rates beyond it, with roughly 3.1 quarter-point hikes implied by November 2027.
- Gold’s 2.06% drop on Wednesday came even as US yields slipped about 1.5bps and the DXY rose only 0.22%, meaning yields and the Dollar do not fully explain the selloff.
- Copper, platinum, silver and oil also fell sharply, suggesting positioning or liquidity pressure as a possible contributor rather than a confirmed explanation.
- Support converges at 3,637.44, 3,606.83 and 3,600, with 3,321.49 below, while 3,890.97 and 4,148.60 mark the resistance levels that anchor the bearish view.


