







TL;DR: Gold slipped below 4,200 on Monday after taking out 4,234.68 and the 61.8% retracement at 4,230.70, turning a persistent oil‑to‑rates headwind into technical damage. 4,113.82 is the next momentum test, and 3,937.19–3,942.43 is the larger structural verdict.
Macro Pressures Trigger a Technical Breakdown
Gold’s rate dilemma has shifted from a lingering fundamental headwind to a clearer technical deterioration. Bullion dropped almost 2% during Asian trade on Monday, slipping beneath 4,200 after breaking 4,234.68 support and, more crucially, the 61.8% retracement of the 3,942.43–4,697.07 advance at 4,230.70.
That overlap is significant. The 4,230 zone is not merely a fleeting support line; it represents the Fibonacci level that underpinned the view that the July‑low rebound at 3,942.43 could evolve into a sustained move. Gold has now retraced more than 61.8% of that rally. While this does not yet confirm that the broader downtrend originating at 5,598.75 has resumed, it considerably undermines the bullish narrative of the August bounce.
One important timing caveat remains. Monday’s session is still in progress; gold has intraday‑broken the support cluster intraday, yet a daily settlement beneath 4,230 would furnish stronger validation. Similarly, the price sits below the 55‑week EMA near 4,225, but only a weekly close under that average would cement a higher‑timeframe breach. The bias is bearish, though the extent of confirmation is still unfolding.
Iran Talks Stall, Sustaining Oil‑Driven Pressure
The fresh bout of selling follows another hiccup in US‑Iran diplomacy. President Donald Trump remarked on Saturday that he had turned down Iran’s newest proposal, which attempted to tie the reopening of the Strait of Hormuz and the resumption of nuclear talks to US concessions such as loosening the naval blockade and easing oil sanctions. Subsequently, US Ambassador to the United Nations Mike Waltz contended that Tehran was demanding “everything up front,” including sanctions relief and access to frozen assets.
Nevertheless, the dialogue remains open. Trump informed Axios on Sunday that he anticipates more talks with Iran this week, while Qatari intermediaries persist with shuttle diplomacy between the parties. Iranian Foreign Minister Abbas Araghchi also reiterated Tehran’s readiness to negotiate. Accordingly, the market should view the situation as an impasse rather than the death of diplomacy.
This distinction is relevant because gold does not require a fresh military flare‑up to remain under pressure. What truly matters for bullion is whether diplomacy can generate sufficient advancement to alleviate the energy‑price shock. So far, it has not. Brent climbed roughly 1.6% and WTI gained about 1.1% in early Monday trade, as skepticism over a swift US‑Iran settlement resurfaced.
The Oil‑to‑Rates Mechanism Remains Dominant
For gold, this scenario extends the dynamic that has prevailed since the Iran conflict ignited in late February. Escalating geopolitical tensions have repeatedly flowed first into oil, inflation expectations, and monetary‑policy pricing, making the rates channel a more decisive influence on gold than the headline geopolitical news itself.
That pressure persists. Markets began Monday with about a two‑thirds chance of another Fed rate hike in October, following September’s quarter‑point lift to 3.75–4.00%. Fed officials have also stressed that inflationary forces are no longer limited to the oil sector.
The importance of Monday’s move lies not in gold’s sudden failure to react to geopolitical risk—a pattern already well known—but in the fact that the identical macro pressure has now pierced a technical threshold that had endured the earlier stages of the decline.
During much of September, gold weakened amid climbing Treasury yields, a stronger dollar, and renewed expectations of further Fed hikes, yet it had not decisively undermined the framework of the 3,942.43–4,697.07 rebound. Monday’s breach of the 4,230 level alters that picture. The rates narrative is no longer a simple explanation for gold’s difficulty in rallying; it is starting to reshape the chart itself.
ActionForex’s Technical Outlook: 4,113 Emerges as the Next Downside Test
Now that the 4,230 level has been breached, focus turns to 4,113.82, which represents the 61.8% projection of the drop from 4,697.07 to 4,234.68, measured from the rebound peak at 4,399.58.
This level serves primarily as a momentum checkpoint rather than a definitive structural boundary. A decisive breach beneath 4,113.82 would indicate that the slide from 4,697.07 is gathering momentum and would heighten the chance of an extension toward the 3,937.19–3,942.43 region. The 100% projection sits at 3,937.19, virtually coinciding with the July low of 3,942.43.
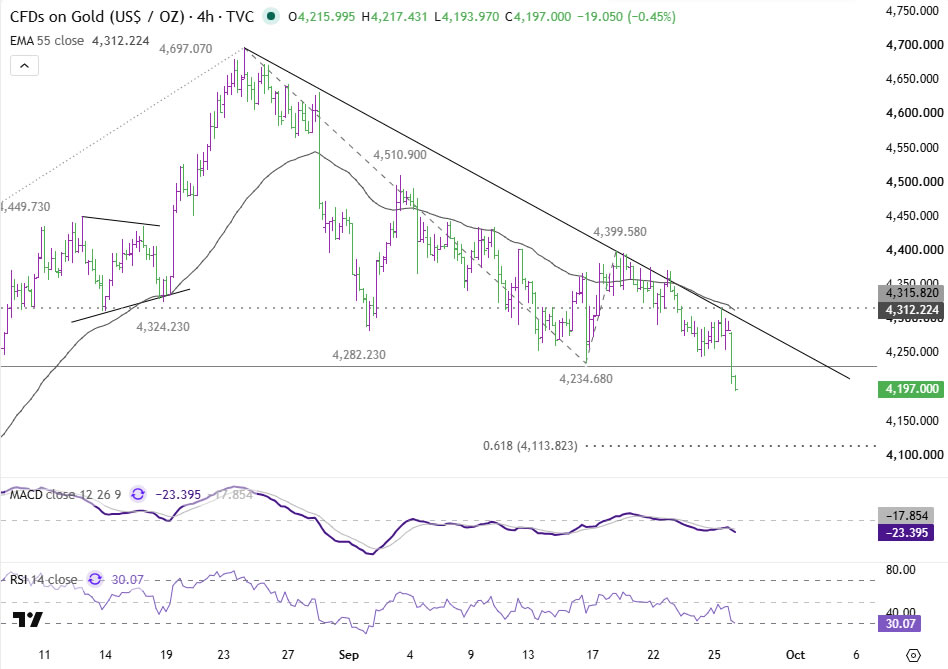

The descent from 4,697.07 does not yet display a clear impulsive character; it could still be read as a corrective move, perhaps a zigzag. However, this interpretation feels less convincing after gold retraced more than 61.8% of the preceding advance.
Should the 3,942.43–4,697.07 advance mark the start of a fresh impulsive uptrend, bulls would generally want the retracement to stay within bounds before this stage. By breaking deeply through the move, the odds increase that the August rally was a B‑leg or corrective rebound nested within the broader decline from 5,598.75. This does not yet constitute confirmation; the decisive test lies further down.

3,942 Marks the Key Structural Decision Point
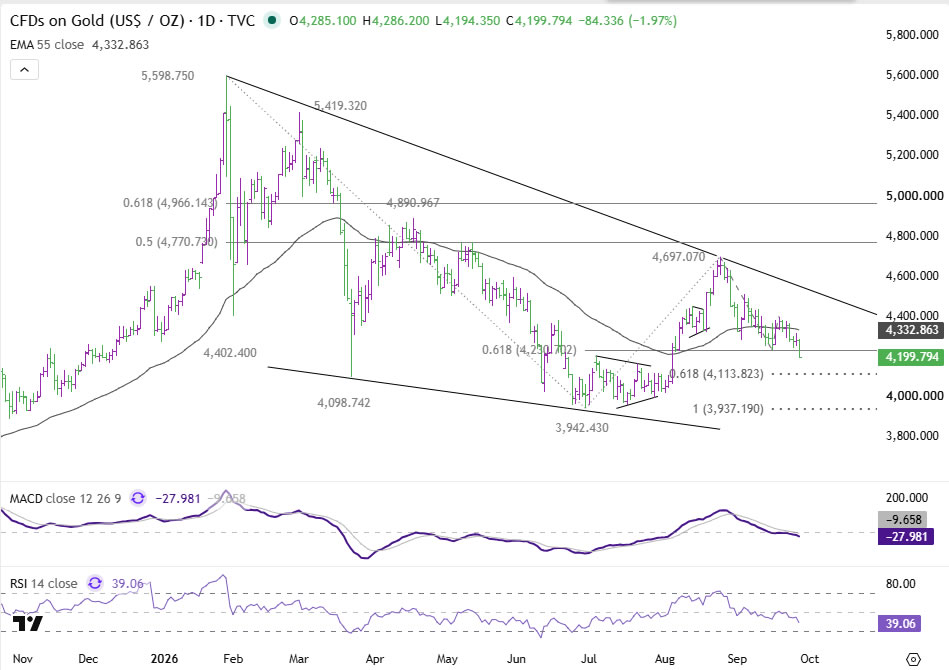
The 3,937.19–3,942.43 band has become the more consequential level. Should gold reach this zone, hold it, and then rebound in a clearly corrective, overlapping pattern that later falters below the 4,399.58–4,402.40 area, the overall price action could still be interpreted as a larger corrective sequence rather than an accelerating bearish trend.
A clear and forceful breach beneath 3,942.43, however, would shift the debate significantly. It would erase the starting point of the full August rebound and furnish far stronger evidence that the broader decline from 5,598.75 has resumed.
The subsequent higher‑timeframe downside reference would then be 3,606.83, which corresponds to the 50% retracement of the full 1,614.92–5,598.75 advance. This level remains far off and should not be regarded as the immediate goal merely because 4,230 has given way. Gold must first validate the move through 4,113.82 and then through 3,942.43.
This sequence matters: 4,230 serves as the warning, 4,113 functions as the momentum test, and 3,942 represents the larger‑trend test.
Bulls Must First Regain 4,315
In the near term, the initial level that could contest the bearish configuration is 4,315.82. This zone lies essentially beside the four‑hour 55‑period EMA near 4,312, offering a blend of static price resistance and dynamic resistance.
Provided that 4,315.82 holds as a ceiling, near‑term risk stays skewed to the downside. The four‑hour RSI has already dipped to roughly 30, so a rebound would not be unexpected following Monday’s steep drop. Yet an oversold bounce by itself would not mend the underlying structure; gold must recover 4,315.82 before there is substantive indication that the breakdown is merely pausing rather than stalling.
The daily outlook is similarly negative. Gold had previously faltered around its 55‑day EMA, which now sits near 4,333, ahead of Monday’s renewed selloff. The weekly chart contributes another caution, as price has slipped beneath the 55‑week EMA around 4,225. Individually, neither signal confirms a renewed long‑term downtrend, but collectively they raise the onus on bulls to reverse the deterioration swiftly.
The Rates Narrative Now Finds Chart Confirmation
The macro case against gold has been evident for weeks: ongoing energy pressure, heightened inflation risk, rising Treasury yields, and revived expectations of further Fed tightening. Until Monday, the technical deterioration had been relatively modest; the day’s action begins to alter that picture.
Diplomacy with Iran remains alive, and any tangible breakthrough capable of pulling oil prices significantly lower could ease the rates‑driven pressure on gold. However, talk by itself is no longer sufficient. As long as 4,315.82 continues to act as a ceiling and the oil‑to‑inflation‑to‑rates transmission mechanism stays intact, near‑term risk remains biased to the downside.
The initial downside objective is 4,113.82. The true test lies near the 3,937.19–3,942.43 zone. Holding that area would preserve the broader corrective view, whereas a decisive break would transform Monday’s slip below 4,230 from a mere alert into a far more consequential signal.
Key Takeaways
- Gold slipped below 4,234.68 and the 61.8% Fibonacci retracement at 4,230.70, thereby retracing more than 61.8% of the 3,942.43–4,697.07 advance and undermining the bullish interpretation of the August rebound.
- Confirmation remains pending: a daily settlement beneath 4,230 and a weekly close under the 55‑week EMA around 4,225 are required before the break can be regarded as decisive.
- US‑Iran negotiations have reached an impasse rather than a collapse, with Trump anticipating further talks this week; meanwhile, oil climbed in early Monday trade, preserving the oil‑to‑rates conduit.
- The 4,113.82 level serves as the momentum checkpoint, and a clear breach would heighten the likelihood of an extension toward the 3,937.19–3,942.43 region, which marks the larger structural decision point.
- Bulls must regain 4,315.82—situated close to the four‑hour 55‑period EMA near 4,312—before there is substantive indication that the downturn is merely pausing rather than stalling.
Also Read
- Bitcoin and Nasdaq Futures Slip as Trump Leaves Iran Strike Options Open
- Oil Prices and AI Demand Boost Ringgit Outlook, Analysts Say
- Treasury Settlement’s $202 Billion Impact on Market Liquidity and Bitcoin Outlook
- Forex Signals September 28: Accenture, Nike, Micron Earnings Preview for the Week Ahead – FXLeaders


