





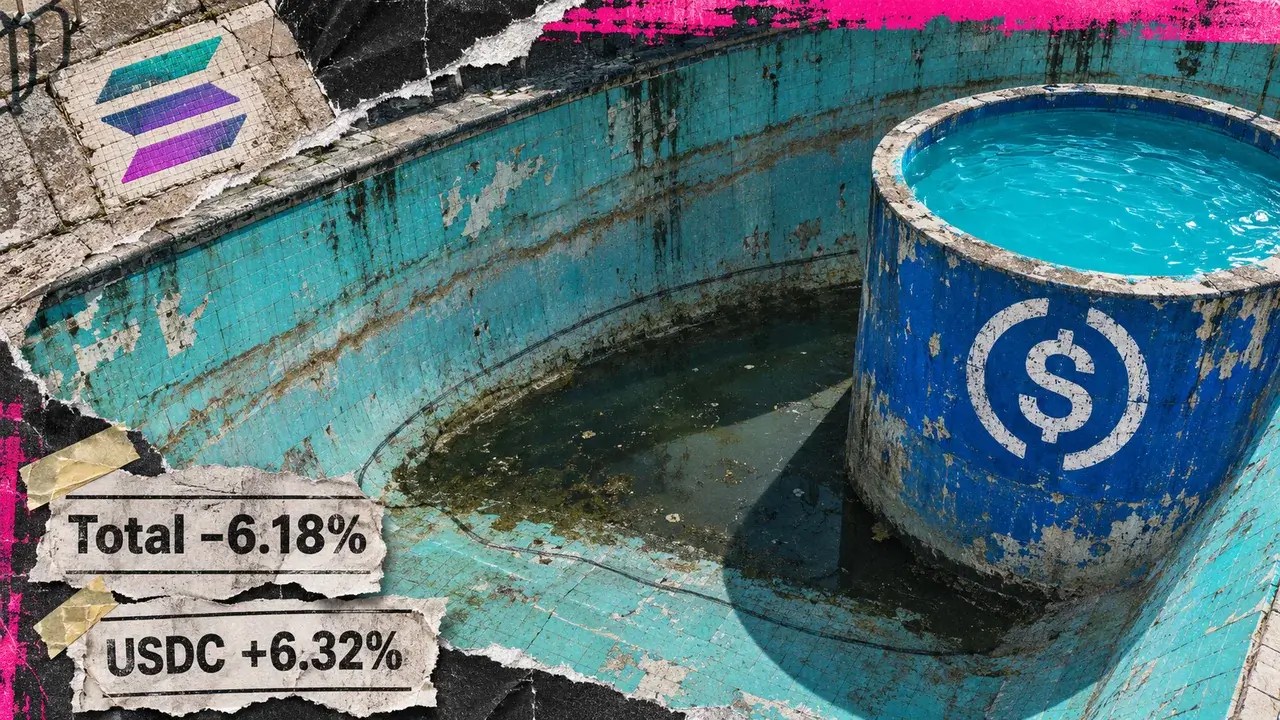
Solana’s stablecoin market is experiencing an uneven contraction. According to data from DefiLlama on Nov. 14, the network’s total stablecoin market capitalization fell by 6.2% over a 30-day period. This decline occurred even as the tracked market cap of Circle’s USDC stablecoin rose by 6.3%. Decreases in Tether’s USDT and several other major stablecoins outweighed the gains seen in USDC.
The data puts Solana’s total stablecoin market at $13.958 billion, with USDC accounting for $7.31 billion, or 52.4% of the network’s tracked stablecoin market. While the overall market contracted, this distribution highlights a divergent funding picture rather than a uniform retreat from stablecoins on the chain.
USDT and other declines outweigh USDC’s gain on Solana
Tether’s USDT stablecoin stood at $2.053 billion, representing a 26.2% drop over the dashboard’s 30-day window. Back-calculations from the rounded balances and percentage changes imply an approximate decline of $729 million in USDT. In contrast, USDC’s corresponding increase was about $435 million, leading to a total stablecoin market cap reduction of roughly $919 million.
These approximate dollar changes are derived from rounded current market caps and reported 30-day percentages. They reflect shifts in tracked value rather than verified cash withdrawals or deposits.
The contraction extended beyond USDT. USD1, the World Liberty Financial stablecoin, fell 26.0% to $1.046 billion, implying an approximately $368 million decline. USDGO fell 15.5% to $1.064 billion, or roughly $195 million under the same calculation. Similarly, Global Dollar (USDG) declined 26.0% (about $156 million), while Ethena’s USDe fell 40.2% (about $187 million).
Together, these substantial declining balances explain why USDC’s expansion coexisted with a smaller chain-wide total. The percentage fall alone does not show an asset’s contribution; for instance, USDe’s steeper contraction represented a smaller dollar change than USDT’s.
USDC was not the only stablecoin growing on Solana. PayPal USD (PYUSD) rose 14% to $782.99 million over the displayed 30-day window, implying an increase of about $96 million. This issuer breakdown reveals a landscape of both expansion and retreat within the same network.
30 days earlier · estimated≈$14.877BUSDC ≈$6.875BOther ≈$8.002BUSDC +≈$435MOther stablecoins −≈$1.354B netNov. 14, 2026$13.958BUSDC $7.31BOther ≈$6.648BSame dollar scale · market cap, not cash flows
30 days earlier · estimated≈$14.877BUSDC ≈$6.875BOther ≈$8.002BUSDC grew; the remaining pool shrank.Nov. 14, 2026$13.958BUSDC $7.31BOther ≈$6.648BSame dollar scale · market cap, not cash flows
Compare the 30-day changes
Compare the 30-day changesSolana issuersUSDC across chains
USDC and PYUSD grew, while USDT fell sharply. Percentages describe each asset’s market cap, rather than its share of Solana’s total.
USDC+6.32%USDT−26.21%PYUSD+14.00%-30%0%+15%
USDC+6.32%USDT−26.21%PYUSD+14.00%-30%0%+15%
USDC grew on Solana while shrinking on Ethereum and globally. Opposite stock changes do not prove direct transfers.
Solana+6.32%Ethereum−7.62%Global−4.90%-10%0%+10%
Solana+6.32%Ethereum−7.62%Global−4.90%-10%0%+10%
USDC’s growth cushions Solana’s total decline. It does not reverse it.
Earlier balances and ‘other’ totals are derived from rounded inputs. Provider 30d endpoints are not independently matched blocks. Market caps include issued/bridged circulating assets at price; they do not establish cash flows, transfer routes or trading depth.
Solana’s USDC growth also contrasts with the same asset elsewhere. On DefiLlama’s Ethereum dashboard, USDC stood at $41.386 billion, down 7.6% over the displayed 30-day period. The global table showed $69.2 billion, down 4.9%.
These Nov. 14 comparisons use the provider’s displayed 30-day windows, rather than independently matched blockchain endpoints. They show where tracked balances changed, without identifying the transactions behind those changes.
The result supports a narrower conclusion than a uniform retreat from USDC: its tracked balance expanded on Solana while declining on Ethereum and globally. Opposite changes alone do not establish that Ethereum holders moved those funds directly to Solana.
This distinction adds to CryptoSlate’s Nov. 11 Solana coverage, which examined concentrated derivatives turnover and aggregate stablecoin contraction using Nov. 10 observations. The current issuer split shows what the chain-wide figure conceals.
What the balances measure
DefiLlama’s definition measures circulating stablecoins multiplied by price, excluding burned and non-issued tokens. Chain totals include assets issued or bridged onto the network. These figures therefore differ from a native-only token count or the reserve assets held by an issuer.
DefiLlama’s USDC tracking code distinguishes locally issued tokens, tokens held back from circulation, and bridged assets on Solana. The dashboard total does not reveal which component explains the 30-day increase.
Circle’s Cross-Chain Transfer Protocol (CCTP) illustrates why a chain-level increase need not mean new cash entered the system. CCTP moves USDC through burn-and-mint transfers between blockchains without traditional bridge liquidity pools. That is a possible mechanism for relocating existing USDC, rather than evidence that CCTP caused the increase measured here.
Treasury inventory introduces another distinction. Tether says authorized but unissued tokens remain outside circulating market capitalization, and redeemed tokens can stay in treasury rather than being burned. A mint or burn count alone would not reconcile the change in circulating balances.
Solana consequently has a smaller tracked stablecoin base with a different composition. USDC’s expansion cushions the overall decline, without reversing it. This serves as evidence of an uneven contraction across stablecoins; the balance data alone cannot show fresh SOL buying or deeper trading liquidity.
Also Read
- Pakistani Rupee Strengthens Against US Dollar in Interbank Trading
- Ondas Stock Slides 4% After Four Analyst Price Targets Are Cut, Even With Record Revenue
- Solid State Issues Update as Shares Slip 3.5% – AskTraders.com
- Google DeepMind Opens PARDIG AI Rainfall Data to Improve Global Flood and Drought Monitoring