




Stellar (XLM) currently resides on a chart pattern that historically remains quiet for years—until its structural integrity demands a closer look from market participants.
According to market analyst TakeProfitNow, XLM has consistently returned to the same broad liquidity zone since 2019, and the price is currently testing this key area once again. On the weekly chart, this base represents a major demand zone that has successfully absorbed multiple multi-year tests without breaking.
Above this critical support zone, a long-term rising trendline projects a path toward the $2.00 and beyond region. From current trading levels near $0.22, this trajectory represents a potential +7,000% move if the broader market structure validates the bullish thesis.
Why this zone keeps mattering
The significance of this zone lies less in short-term trading opportunities and more in the power of market memory and historical liquidity dynamics.
$XLM is one of those charts people ignore for years…
then suddenly ask why nobody warned them.
Look at the structure.
Since 2019, price has repeatedly returned to the same massive liquidity zone
and it’s sitting there again right now.
Meanwhile, the long-term trendline… pic.twitter.com/OKBaAO6pHl
— @TakeProfitNow (@TakePr0fitN0w) October 4, 2026
When an asset revisits the same major liquidity pool across different market cycles, technicians closely monitor whether buyers are still active in defending the zone. XLM’s historical chart shows several strong reactions from this lower band, which is why the current retest is garnering significant attention from traders.
The projected upside target is intentionally aggressive. A trendline pointing toward the $2.00 region represents a cycle-scale objective rather than a short-term, next-week target. This is precisely why the outlook is framed as sounding “ridiculous”—major cryptocurrency expansions often appear highly unrealistic when viewed from the consolidation base that eventually launches them.
What XLM bulls still got to prove
A bounce from the liquidity zone is merely the initial condition for a potential rally. For the long-term trendline case to gain meaningful traction, XLM bulls would need to demonstrate sustained price acceptance at higher levels, attract stronger market participation, and benefit from a broader risk-on macro backdrop.
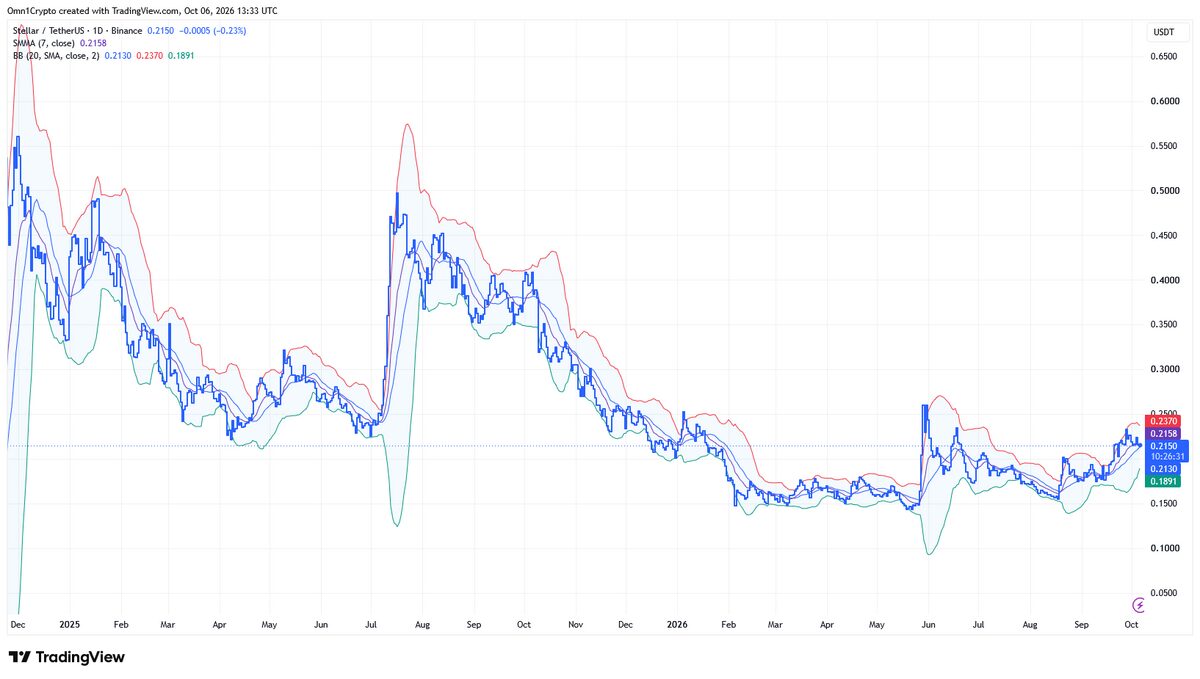
On smaller timeframes, the charts point to $0.235 as the immediate resistance level to watch in the near term, even as the broader cryptocurrency market continues to trade sideways. In other words, the XLM price setup is becoming increasingly interesting because this level has historically acted as a familiar launchpad in previous bullish phases.
However, a retest of the liquidity zone does not automatically ratify the bullish thesis; price action must confirm the commitment of buyers.
Also Read
- Forex Signals October 7: LEVI, APLD, and HKD Earnings Take Center Stage This Wednesday
- OKX Hits $25 Billion Valuation via Strategic Round; CEO Insists Capital Wasn’t the Driver
- FinCEN drops crypto mixing proposal as backlash kills rule
- DOJ Continues Tornado Cash Prosecution as Treasury Withdraws Crypto Mixer Reporting Proposal