


Key Highlights
- USD/JPY struggles to breach the 159.65 resistance level.
- The pair slipped below a bullish trend line with support at 159.40 on the 4-hour chart.
- EUR/USD remains pressured near the 1.1675 resistance zone.
- Gold saw some recovery and tested the $4,525 resistance level.
USD/JPY Technical Analysis
The US Dollar extended its rally against the Japanese Yen, pushing above 158.50 and 158.80. USD/JPY briefly surpassed 159.20 before encountering selling pressure.
On the 4-hour chart, the pair settled above the 158.50 level, the 100-day simple moving average (red), and the 200-day simple moving average (green). However, it encountered resistance near the 159.65 level.
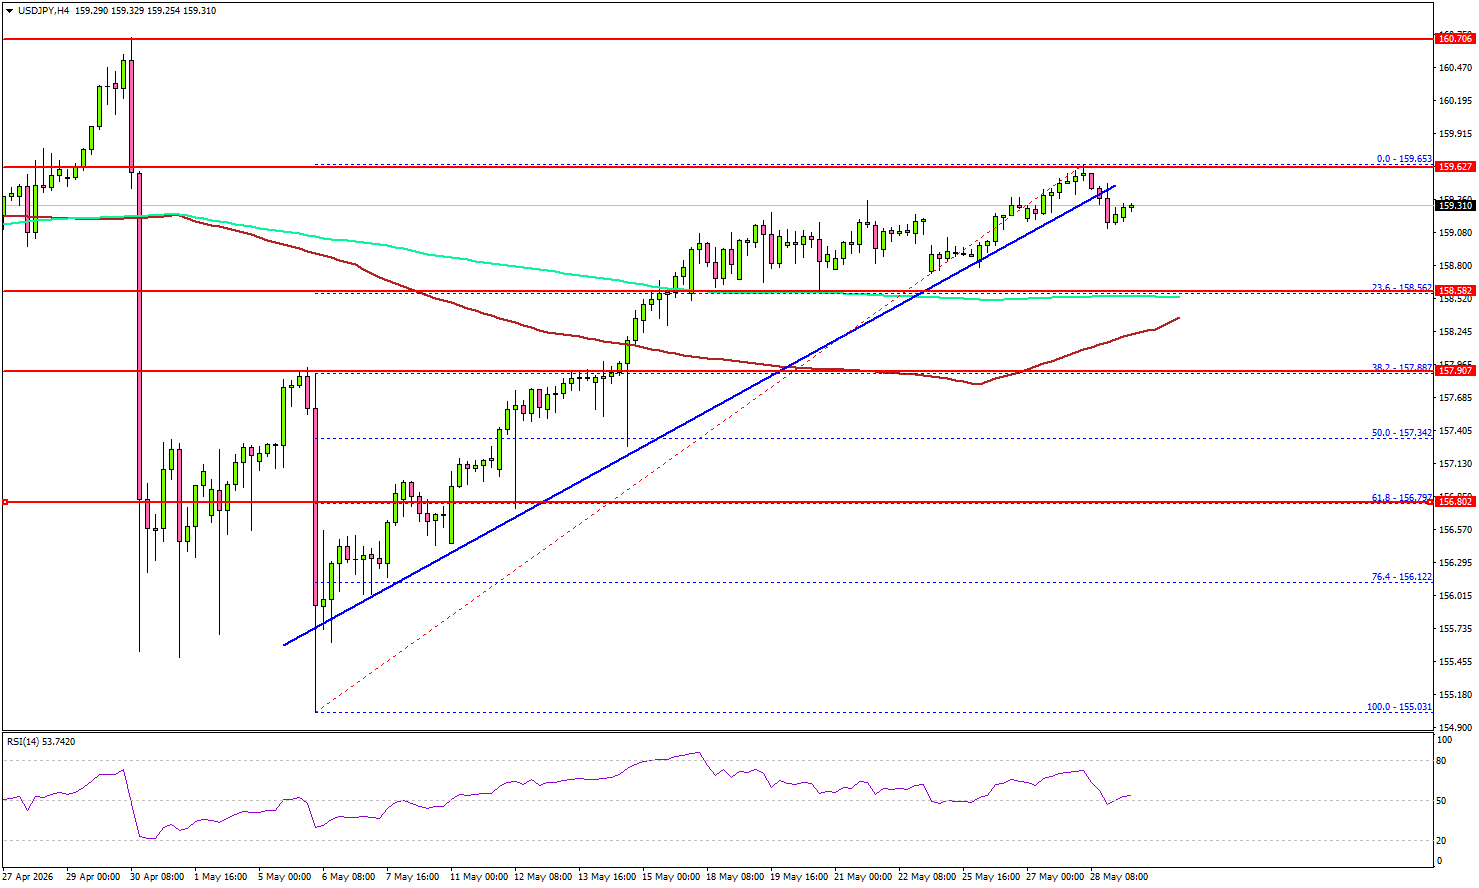

The recent peak was recorded at 159.65, and the pair is now retreating from this resistance. Momentum has dipped below the bullish trend line connecting support at 159.40. Recent losses may test the 23.6% Fibonacci retracement level of the upward move from the 155.03 swing low to the 159.65 high.
Initial support is positioned around the 158.50 level and the 100-day simple moving average. Further downside pressure could push the pair toward the 157.85 level. A break below this point may accelerate losses toward the 61.8% Fibonacci retracement at 156.80.
Extended weakness could see the pair test the 156.00 threshold. To the upside, resistance remains capped near 159.65, with the next key level at 160.00. A sustained close above 160.00 could pave the way for continued upward momentum targeting 162.00.
Turning to EUR/USD, the currency pair is attempting to rebound from recent lows but continues to face significant resistance near 1.1675.
Key Economic Events Upcoming:
- Fed Governor Bowman’s speech.
- Fed Governor Paulson’s speech.
- Chicago PMI for May 2026 – Forecast 49.7 vs 49.2 previously.
Also Read
- JPMorgan Reports Worsening Bitcoin Mining Economics Amid Lower Prices
- fmas:26 Financial Services Summit Delivers Networking and Industry Insights Across Africa
- Gold Slips as Fed Rate-Hike Expectations Fuel Dollar and Yield Rally
- Charles Schwab Enters Prediction Markets with S&P 500 Binary Options Launch


