







XRP has arrived at the $1.10 support target, placing the price squarely within a Fibonacci convergence zone that has been under scrutiny since the asset broke below $1.26 earlier this month.
On Coinbase’s four-hour chart, XRP touched exactly $1.1000 on November 8 before stabilizing near $1.12 during the observed session. CoinMarketCap data from November 9 shows the token trading close to $1.10, confirming that this support level remains under immediate pressure.
The significance of $1.10 stems from the intersection of two distinct retracement structures: a local 0.854 Fibonacci level at $1.0999 and a broader 0.786 retracement near $1.0912.
XRP Reaches Fibonacci Confluence Near $1.10
The decline initiated after XRP failed to maintain its September recovery around the $1.50–$1.60 region. Price subsequently printed a series of lower highs before surrendering the $1.2658 Fibonacci support. Selling pressure then accelerated toward the next retracement at $1.1477, which also failed to spark a sustained recovery.

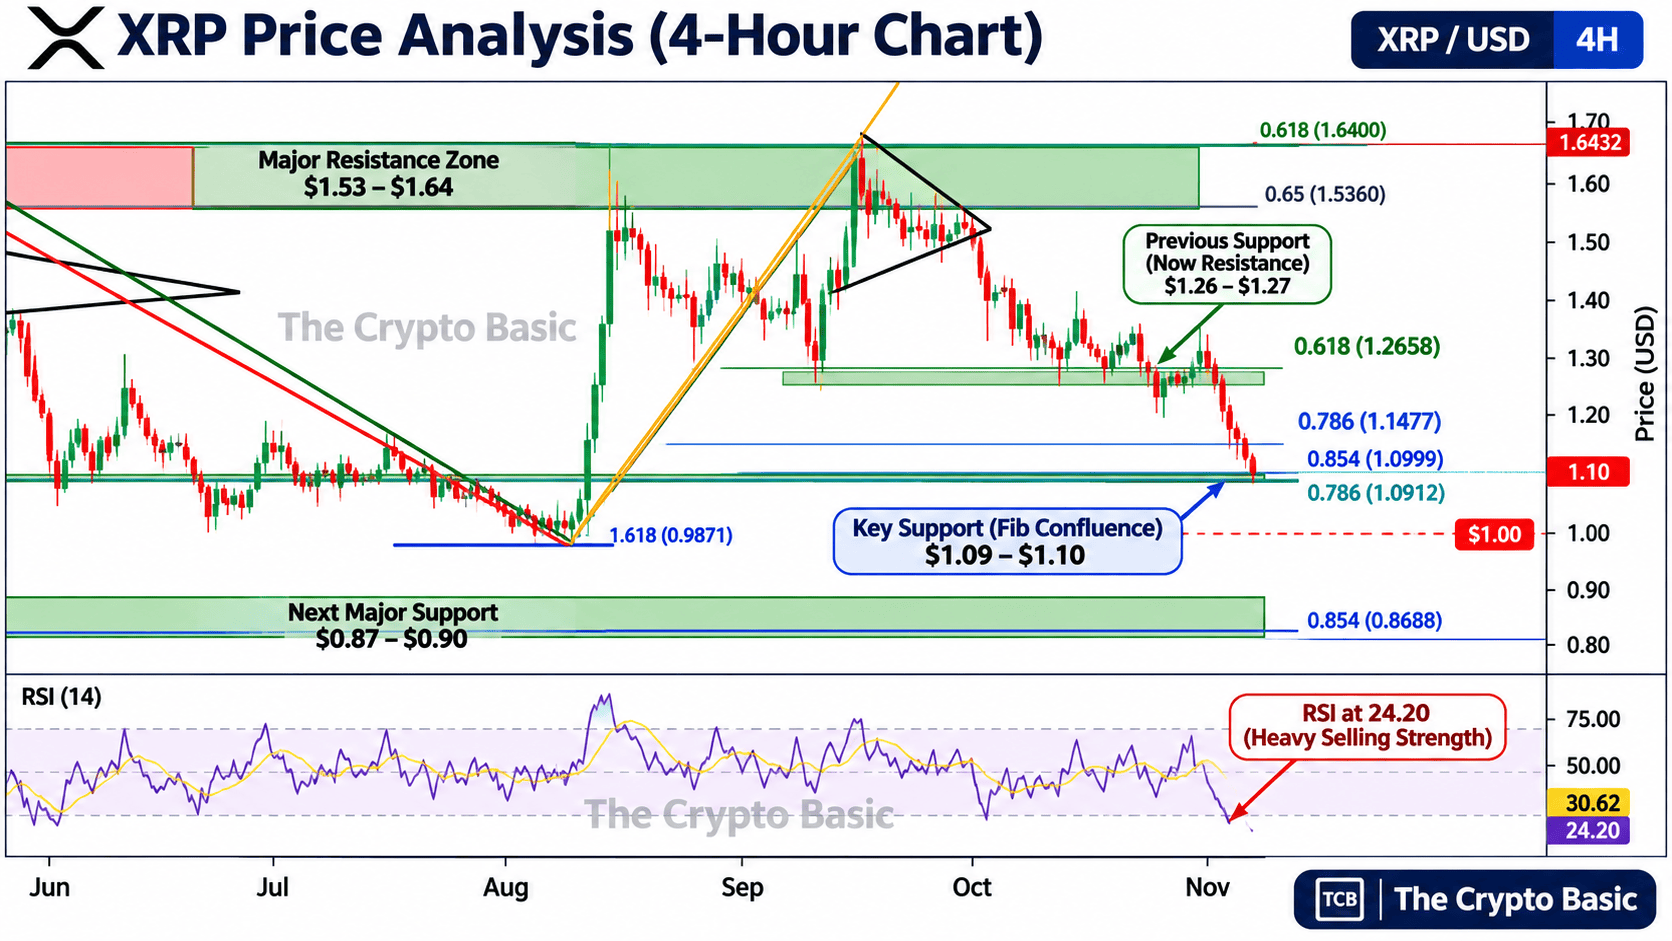
The most recent leg down brought XRP into the $1.09–$1.10 area. This development aligns with prior analysis identifying $1.10 as the next major level after the loss of $1.26, while a separate structure positioned the broader support zone between $1.10 and $1.29.
The current test is therefore more than psychological support at a round number; two independent Fibonacci structures are converging in roughly the same price region.
RSI Remains Deeply Oversold
Momentum indicators have yet to signal that sellers are exhausted. The four-hour RSI reads near 24.20, well below the conventional oversold threshold of 30, while a secondary momentum line sits around 30.62.
While an RSI below 30 can precede relief rallies, it primarily confirms that downside momentum has been unusually persistent. Oversold conditions alone do not establish a bottom.
This distinction is critical because XRP has already reached $1.10 without producing a decisive reversal. A meaningful bullish signal would require price to stabilize above the Fibonacci support and begin reclaiming lost levels. The first significant overhead retracement sits near $1.1477, followed by the more pivotal $1.2658 area.
Until XRP starts recovering those levels, any rebound remains vulnerable to a retest of $1.10.
Break Below $1.09 Brings $1.00 Into Focus
The downside structure gains importance if buyers cannot defend the current zone. A move beneath the macro 0.786 retracement at $1.0912 would shift attention to the psychological $1.00 level as the next major area of interest.
The chart contains an additional technical reference near $0.9871, closely aligning with the $1.00 region. From $1.10, a decline to $1.00 would represent a further 9.1% loss.
This area carries historical weight; XRP traded near $1.00 during its August low before launching a recovery toward $1.70. Recent analysis has similarly highlighted the $1.00 region as lower fair-value-gap support.
Should $1.00 fail, the deeper Fibonacci structure identifies approximately $0.8688, bringing the broader $0.87–$0.90 region into play. A separate technical setup recently flagged roughly $0.90 as the next major downside zone beneath the $1.00 area.
Buyers Must Validate $1.10 as a Bottom
The $1.10 target has been reached, but arriving at support is distinct from confirming it will hold. For the immediate structure to improve, XRP must first prevent sustained trading below $1.09–$1.10 and recover $1.1477. A more robust reversal would require reclaiming $1.2658, which previously served as a key support floor before the latest breakdown.
Until those recoveries materialize, another test of $1.10 remains probable, while a clean break beneath the Fibonacci convergence would shift focus toward $1.00 and potentially the $0.87–$0.90 region.


