




[XRP Pulls Back Below $1.55 After Strong Uptrend, Key Support Zone Faces Fresh Test]
XRP Pulls Back Below $1.55 After Strong Uptrend, Key Support Zone Faces Fresh Test
XRP has reversed momentum after a brief rally, declining from the $1.64 zone down toward $1.49 as selling pressure intensified.
Current data from CoinMarketCap shows XRP trading around $1.49, down 5.64% over the last 24 hours, with a daily range limited between $1.49 and $1.65. Trading volume hovers near $8.33 billion and market capitalization sits at approximately $93.74 billion.
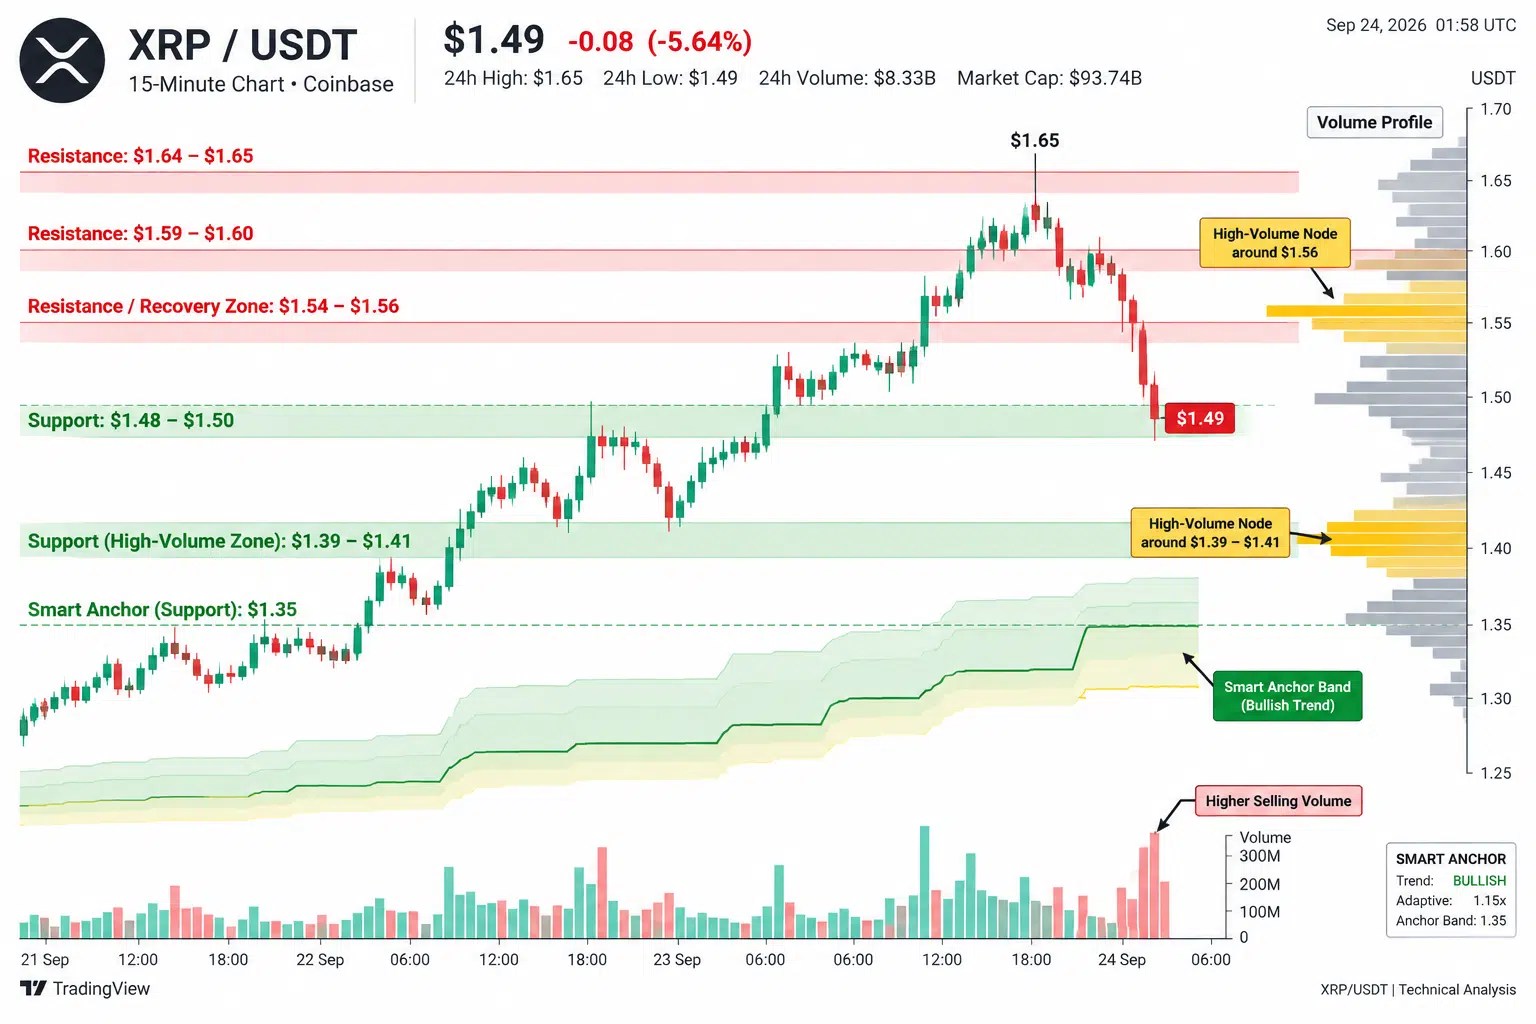
The 15‑minute XRP/USD chart highlights rapid structural changes. Price action moved from roughly $1.38 on September 21, surged through $1.50 and $1.56, and peaked in the $1.64–$1.65 corridor before retracing down to about $1.49.
Shift in Support Dynamics
The volume profile marks a prominent high‑volume cluster near $1.56, but XRP has slipped beneath that level. The subsequent downtrend also cleared the $1.54 threshold before hitting $1.49.
Immediate support materializes around $1.48–$1.50, where the most recent candle displayed a pronounced lower wick following the selloff. Below this zone lies another significant volume accumulation near $1.39–$1.41. The oscillator’s rising anchor band sits considerably lower, close to $1.35, while the overall context still cites a bullish trend.
On the upside trajectory, the $1.54–$1.56 band now functions as the primary recovery window. Above it, earlier high‑volume zones near $1.59–$1.60 and the recent peak close to $1.64–$1.65 serve as upcoming resistance boundaries.
Recent fifteen‑minute candles reveal a clear push by sellers. Large red bodies drove XRP below $1.56 and $1.54, while the latest candle pushed toward $1.48 before climbing back toward $1.49. That shorter red wick indicates buying interest near $1.48, yet the pattern remains dominated by bearish body size. Selling volume expanded throughout the decline, reinforcing the downward move.
Binance Leads Heavy Long Bias
A positioning chart offers an additional perspective on the pullback. Binance’s top‑trader long‑short ratios indicate that roughly 70 % of leading accounts hold long exposure, leaving about 30 % short in the latest four‑hour period. The corresponding long/short metric stands at close to 2.65, confirming the predominance of long stakes.

Positional depth confirms the tilt: the latest top‑trader long/short ratio reaches about 2.6, with greens representing roughly 70 % long exposure and roughly 30 % short.
Such heavy long bias casts $1.48–$1.50 as the central node of the immediate price frame. A bounce would first target the $1.54–$1.56 corridor, while further declines would open up the $1.39–$1.41 zone for testing.
The broader movement stays sizable despite the retreat. CoinMarketCap’s end‑day figures place XRP near $1.49, roughly 15 % higher than late‑September levels when the asset sat close to $1.30—but still appreciably below the earlier $1.64–$1.65 ceiling.
Also Read
- GBPUSD Elliott Wave Outlook: Downside Extension and Critical Wave Count – Action Forex
- AI Coding Slashes Quantum-Safe Bitcoin Transaction Cost Estimate from $320 to $66
- ASIC Defines Trading Algorithm Standards, Giving Market Until 2028 to Align
- Bitcoin Slips Below $84K, Dogecoin Leads Crypto Decline as Treasury Yields Surge to 2007 Highs