




The analysis rests on a weekly chart that emphasizes recurring patterns. FET has spent most of the recent cycle drifting lower beneath a descending trendline.
According to Mikybull’s chart, that ceiling is being retested, and the formation closely resembles the patterns seen before earlier upward moves.
A Repeating Chart Pattern
The weekly chart shows that each time FET squeezed beneath falling resistance before breaking out, it launched significant rallies — turning extended declines into multi‑month advances.
Mikybull contends that the present setup mirrors those past episodes. The price is approaching the same descending resistance that previously capped the base. Should that resistance break decisively, a new expansion phase could begin.
At the time of writing, FET hovered near $0.23 — well below its previous cycle peaks and distant from the $9 goal. This distance makes the target ambitious; reaching $9 from here would require a full‑cycle recovery rather than a small rebound.
Why the $9 Target Is Proposed
The $9 bullish target is not a short‑term forecast; it is a macro‑level objective derived from the magnitude of earlier breakout legs on the weekly chart. Mikybull hinted at this idea a day earlier, noting that an additional “banger chart” would support the FET thesis and quiet the skeptics.
The published chart illustrates this visually, showing prior breakouts, highlighted expansion zones, and a projected upside area extending into the high single digits. In this context, the current attempt to reclaim resistance is merely the opening move, not the full picture.
What FET Must Still Demonstrate
Testing the descending trendline does not equal a confirmed breakout. FET must first clear and sustain a position above the resistance that has capped the downtrend. Without that decisive move, the pattern remains an intriguing analogy rather than a verified reversal.
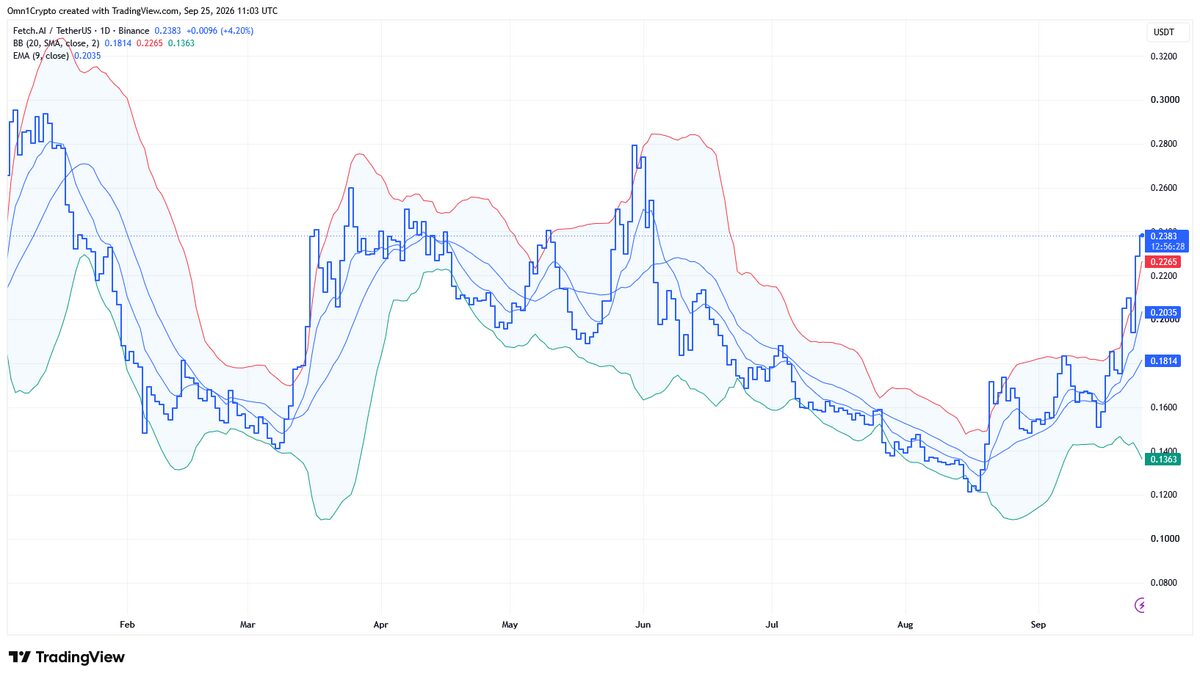
Momentum context matters too. The weekly oscillator indicates there is room to rebuild after an extended period of weak readings, but any follow‑through will hinge on whether buyers can convert the trendline break into lasting higher‑price acceptance.
Mikybull’s argument is straightforward: FET is testing a familiar weekly resistance zone, past breaks from comparable setups have sparked substantial rallies, and his measured upside target on the chart lies near $9.
Consequently, the near‑term level carries more weight than the headline target. If FET can breach the descending resistance and maintain that break, the broader bullish narrative gains credibility.
Also Read
- EU Regulatory Body Calls for Assessment of DeFi Lending Frameworks
- Solana’s 150-Millisecond Settlement Upgrade Advances to Second Public Testnet
- XRP Ledger’s Batch Upgrade Delayed to October 9 Following Validator Support Issues
- Bitget’s $387.5M Breach Highlights Custody Divide Between Institutional and Retail Users