



The global cryptocurrency market experienced several multi-billion-dollar liquidation events over the past weekend, unsettling investors as major-cap assets fell below key thresholds. XRP is currently trading at $0.95, marking a three-month low.
Analyst Projects $18 XRP Target Based on Multi-Year Pattern
On Monday, veteran analyst Ali Martinez identified a multi-year ascending triangle on XRP’s weekly chart dating back to 2017. The pattern suggests the current 43% decline from the October high of $1.55 could test the rising lower trendline near $0.78 as critical support.
XRP COULD BOTTOM AT $0.78
A big ascending triangle appears to have been developing on XRP’s weekly chart since 2017.
With $XRP now down more than 43% from its October high of $1.55, this structure suggests the correction could extend toward the triangle’s rising trendline at… pic.twitter.com/AjOOE5oKET
Track the live XRP price: XRP to USD chart, market cap, volume and price history.— Ali Charts (@alicharts) November 16, 2026
If the $0.78 demand zone holds, a recovery toward the triangle’s horizontal resistance at $3.50 could follow. A weekly breakout and successful retest would validate the pattern, potentially paving the way for Martinez’s $18 price target.
Converging Resistance Levels Emerge: Key Zones to Watch
Other analysts adopt a more cautious stance. The More Crypto Online team notes that XRP’s recent price action shows a weak reaction without a confirmed local low, identifying the $0.98 zone as a key level that must be surpassed to signal a bottom.
$XRP is showing only a weak reaction so far, and there is no signal for a low yet. The first resistance is still the zone between $0.981 and $1.09. The price needs to rise above this first resistance to signal that a local low is in. pic.twitter.com/Qdu8CfaZg6
— More Crypto Online (@Morecryptoonl) November 16, 2026
The 4-hour chart, analyzed through Elliott Wave theory, suggests two plausible bottom scenarios, provided XRP does not reclaim the lower boundary of the first resistance zone at $0.98.
From the Fib extensions drawn on the chart:
- 1.236 extension ≈ $0.861
- 1.38 extension ≈ $0.796
Meanwhile, French analyst Egrag highlights a recurring macro fractal across three major XRP cycles where price tests descending trendlines and the 21-day exponential moving average (EMA). Like Martinez, Egrag projects double-digit targets of $10 and $16 following the current shake-out.
#XRP – THE “SHIT-YOUR-PANTS WICK” IS BACK FOR ROUND 3! before ( $6-$10-$16-$31)
GUYS, LOOK AT THIS MACRO FRACTAL!
I’ve been tracking THREE descending trendlines across #XRP’s major cycles!
LINE 1⃣: #XRP pumped, retested the 21 EMA, then printed a terrifying downside… pic.twitter.com/cPwSLmZYo3
— EGRAG CRYPTO (@egragcrypto) November 14, 2026
XRP is currently trading below all four moving averages on the MA Ribbon, according to TradingView data. In October, the 200-day EMA served as strong resistance that XRP failed to breach. Now, confluent resistance has added a second layer, reinforcing a bearish outlook below $1.15.
A more significant signal comes from the Chaikin Money Flow (CMF), an indicator measuring institutional sentiment. On Monday, the CMF posted deeply negative readings below -0.17, indicating heavy selling pressure among large investors while XRP remains below $1.
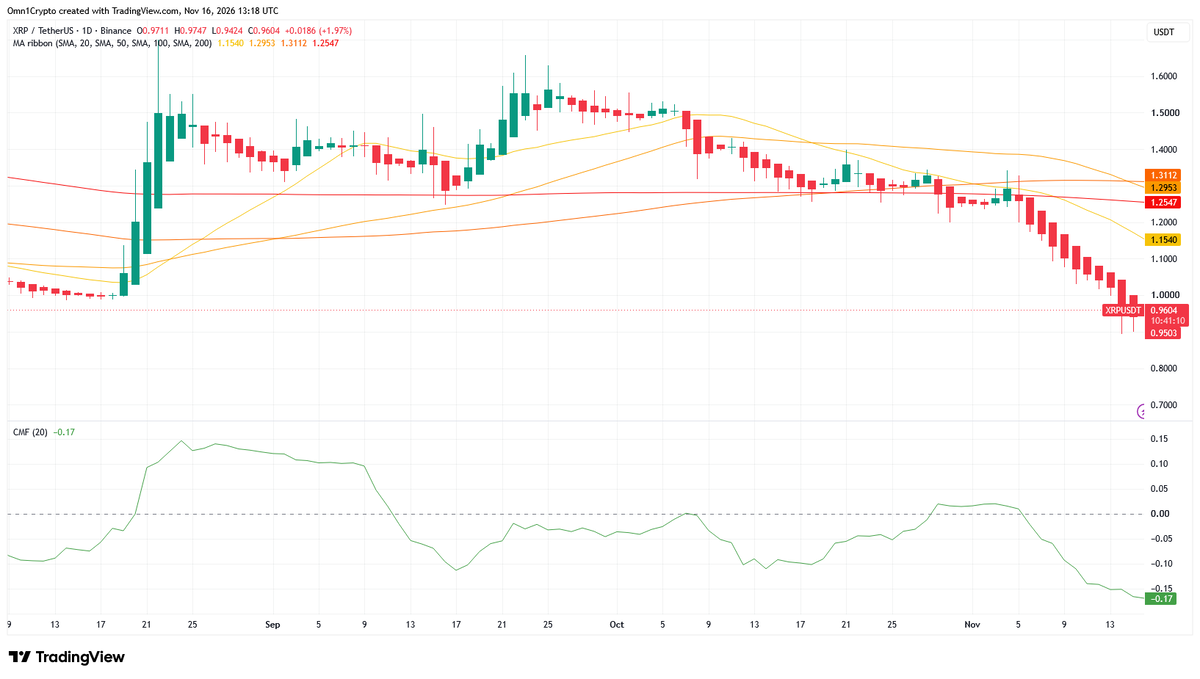
XRP’s exceptionally high correlation with Bitcoin (BTC) and Ethereum (ETH) is casting a bearish shadow as sell-offs intensify across the digital asset sector, still digesting last week’s Nvidia-related turbulence. Absent fresh buying momentum, the 1.38 Fibonacci extension at $0.79 remains a plausible downside target.
Also Read
- KuCoin Opens $1.1 Million Black Friday Rewards Campaign Across Trading and Payments
- Pakistani Rupee Strengthens Against US Dollar in Interbank Trading
- Solana’s Stablecoin Market Contracts by $919M Amid Divergent USDC Growth
- Ondas Stock Slides 4% After Four Analyst Price Targets Are Cut, Even With Record Revenue