







TL;DR: The Dollar Index closed near 101.03 following a hawkish Federal Reserve-driven rally, but it is now approaching genuine resistance at 101.80–102.86 rather than breaking from support. Clearing this zone will likely require the 10-year Treasury yield—not the already-stretched 2-year—to extend further.
The Straightforward Phase of the Dollar Rally May Be Concluding

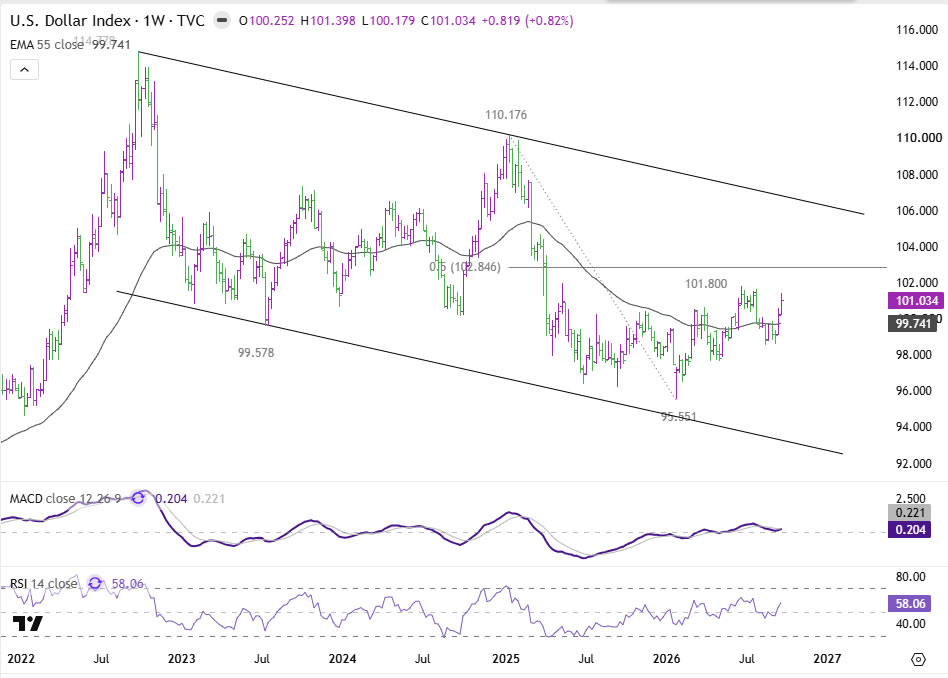
The Dollar finished last week with strong momentum after another broad-based advance. The Dollar Index settled around 101.03, having reclaimed its 55-week EMA near 99.74 and extended a two-week rally fueled primarily by rising U.S. yields and increasingly hawkish Fed expectations. However, the technical landscape is shifting. DXY is no longer emerging from support; it is nearing a genuine resistance cluster at 101.80–102.86, where 101.80 marks horizontal resistance and 102.86 represents the 50% retracement of the decline from 110.18 to 95.55.
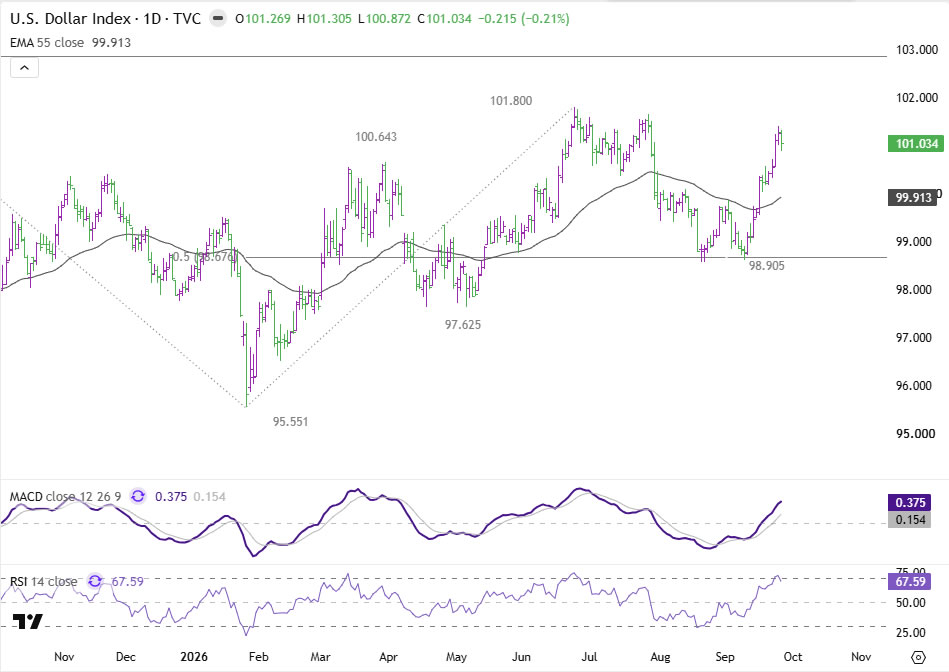

This leaves the Dollar with room to advance further, but it also signals that the straightforward phase of the rally may be ending. Reaching the 101.80–102.86 zone would require only a continuation of the forces already in play. Breaching it decisively would be a different matter entirely. That would likely demand a fresh extension of the rates narrative rather than mere follow-through from last week’s Fed repricing. Above 102.86, DXY would begin to open a much larger technical path toward the upper boundary of the multi-year descending channel. Until then, the immediate question is whether rates retain enough momentum to carry the Dollar through its first major resistance test.

The Front End Has Already Priced In the Hawkish Shift
The catalyst behind last week’s move was unambiguous. The Fed raised its policy rate by 25 basis points to 3.75–4.00% at its September 15–16 meeting in a unanimous 12-0 decision. The accompanying projections were similarly hawkish: 16 of 18 participants placed the appropriate year-end rate above the current midpoint, signaling most officials still saw room for at least one additional increase this year.
That signal was reinforced during the week. Federal Reserve Governor Michael Barr stated “further policy adjustments are likely to be needed,” while characterizing growth as strong, the labor market as solid, and inflation as still above target. S&P Global’s September flash survey then showed the PMI Composite jumping from 56.0 to 58.4, its highest since July 2021, with cost growth accelerating to nearly a four-year high partly due to renewed energy pressures and capacity constraints. PMI Services rose to 58.7, while PMI Manufacturing reached 57.0 and Manufacturing Output 56.7.
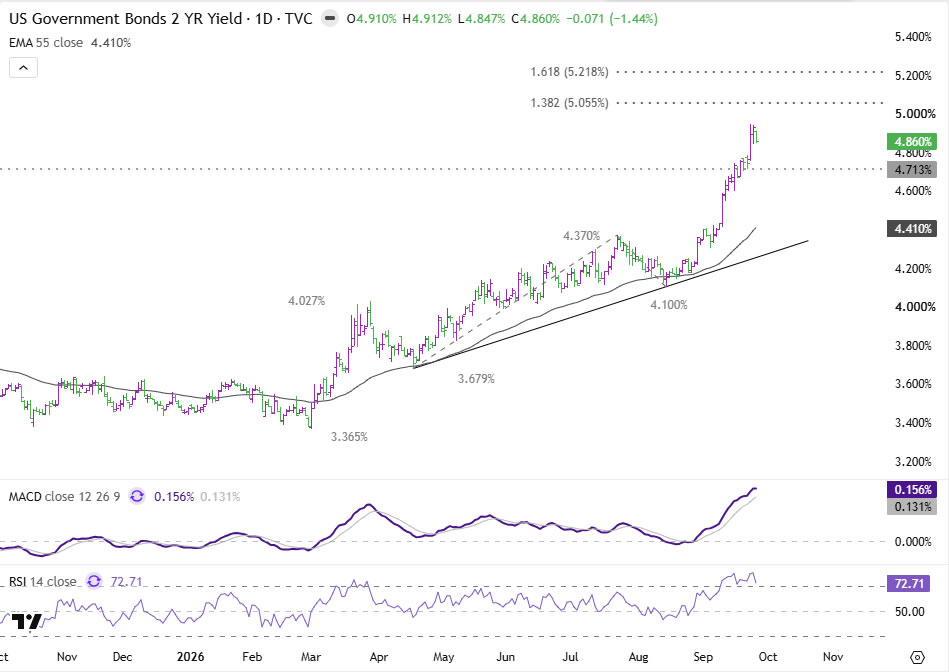
Markets reacted aggressively. The 2-year Treasury yield surged as high as 4.912% before easing to 4.86% by week’s end. However, after such a sharp adjustment, the front end is becoming a less convincing signal for another Dollar leg. Daily RSI is already above 72, while the yield approaches both the psychological 5% level and the next projection around 5.055%. Fed pricing also retreated from its midweek extreme into Friday. The 2-year can still move higher, but a substantial extension increasingly requires new information rather than repetition of a hawkish message that has already been absorbed.
The 10-Year Now Holds the Primary Key
The more critical signal may now reside further out the curve. The 10-year Treasury yield reached 5.228% last week before closing around 5.17%, probing the upper boundary of its rising channel without yet delivering a decisive breakout.
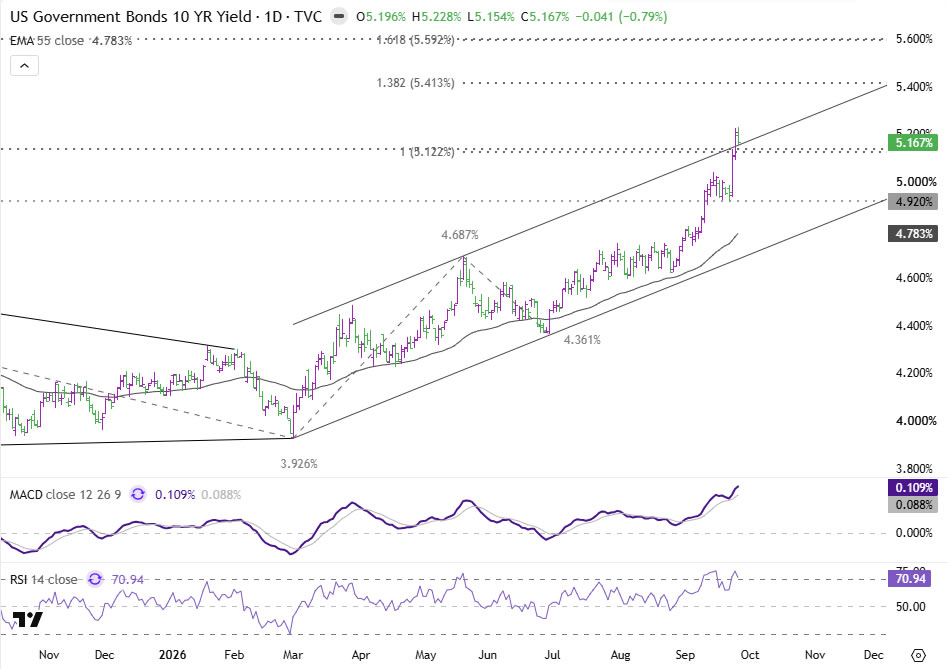

This makes the 10-year the clearest technical and macro swing factor for the Dollar. A sustained break through the recent high and channel ceiling would signal the bond selloff is intensifying at the long end. The next measured objective would be the 138.2% projection of 3.926% to 4.687% from 4.361%, at 5.413%.
Such a move would matter because longer yields incorporate more than the probability of one additional Fed hike. They also reflect expectations around persistent inflation, resilient growth, term premium, and the supply of duration. If the 10-year pushes toward 5.4% even while the 2-year becomes stretched, the same rate-differential channel that powered last week’s Dollar rally would still be expanding. That would provide the strongest argument for DXY eventually clearing 102.86 rather than stalling there.
Conversely, failure by the 10-year to hold above the channel ceiling would remove the clearest source of additional fuel just as DXY reaches resistance.
Equities Signal the Growth Narrative Remains Intact
Equities are sending a different message from bonds, but not necessarily a contradictory one.
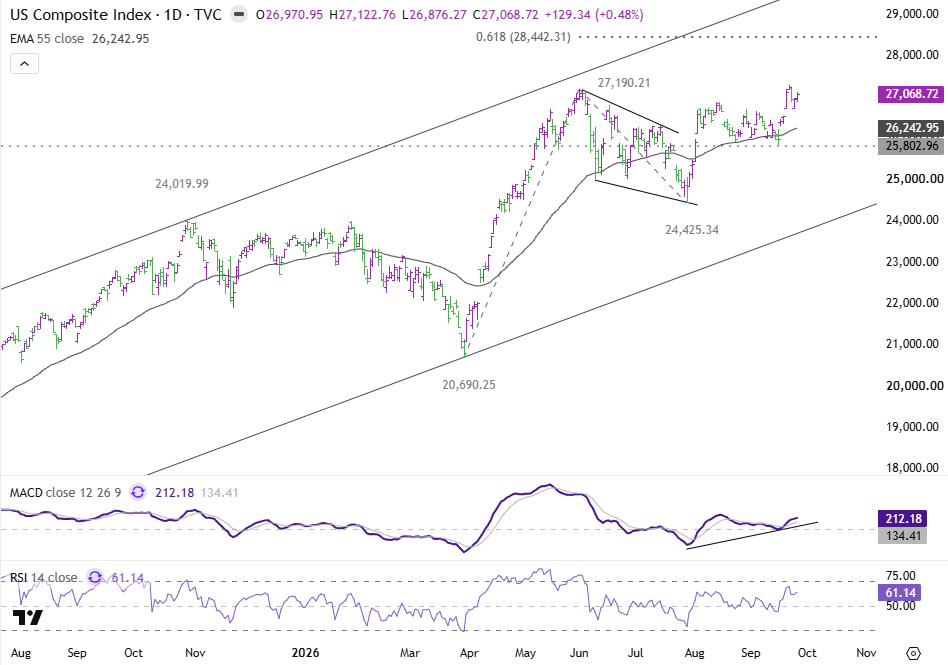
The Nasdaq Composite remains technically constructive around 27,069, above its rising 55-day EMA and still pointing toward the 61.8% projection of 20,690 to 27,190 from 24,425, at 28,442. The index has been supported by renewed AI optimism, and some of its strongest sessions have occurred even as oil and yields jumped. This suggests the equity rally and Dollar rally have been running on partly separate tracks rather than representing one unified risk trade.

The Dow is less convincing, but it continues to defend the 38.2% retracement of 45,057 to 54,749, at 51,049. A break above roughly 52,324 resistance would complete a double-bottom pattern, marking the end of the corrective fall from 54,749 and reversing it.
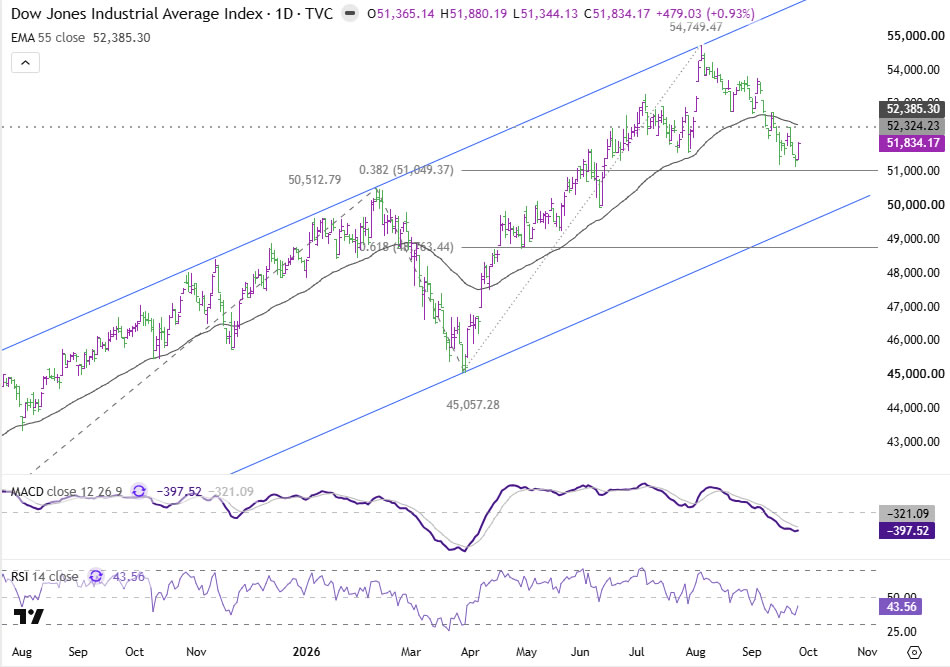
For the Dollar, the main importance of equity resilience is indirect. An extended record run in the Nasdaq and a bullish reversal in the Dow would likely limit the Dollar’s upward momentum through the risk-on sentiment channel.
Oil Presents the Clearest Bearish-Dollar Counterweight
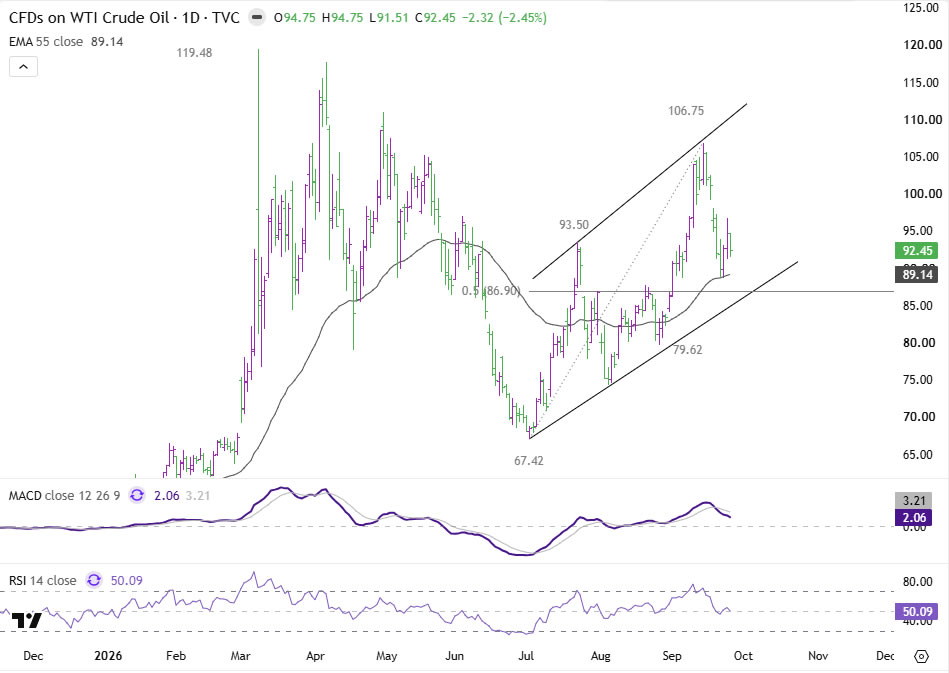
Oil presents the most direct challenge to the Dollar’s inflation-and-rates mechanism. WTI fell almost -8% last week, from around $100.30 to $92.45, as markets placed more weight on the possibility that diplomacy could eventually ease disruption around the Strait of Hormuz. Iran has said it would be prepared to reopen the strait within a week if the U.S. reduced military pressure and lifted its blockade, although that remains a conditional proposal rather than a completed agreement.
The technical picture now warrants close attention. WTI is approaching its 55-day EMA around $89.14, followed by the more consequential $86.90 level, the 50% retracement of the advance from 67.42 to 106.75. A sustained break below 86.90 would strengthen the case that the entire rise from 67.42 has completed as a corrective three-wave move, opening room toward the low-80s area.

The Dollar connection is straightforward but should not be overstated. Last week’s strong U.S. PMI data showed renewed pressure from fuel, transport, and other energy-related costs. If oil continues falling, one source of that inflation pressure begins to fade. The bearish-Dollar chain would therefore be oil lower, inflation pressure softens, Fed tightening expectations ease, Treasury yields retreat, and the rate advantage supporting DXY narrows.
Oil alone is not enough. If U.S. growth and employment remain very strong, the Fed tightening case can survive cheaper energy. But a break in WTI below 89.14 and then 86.90 accompanied by falling yields would directly challenge the mechanism that drove last week’s Dollar surge.
Reaching 102.86 Is One Question; Breaking It Is Another
The setup therefore resembles less a simple continuation call and more a decision tree.
DXY still has room to advance into 101.80–102.86. That would be consistent with the existing momentum, a weekly close back above the 55-week EMA, and a still-hawkish U.S. rates backdrop. But the resistance zone is where the hurdle becomes materially higher.
If the 10-year breaks decisively above 5.23% and begins moving toward 5.413%, particularly alongside another round of strong U.S. data, the Dollar would have the additional rates impulse needed to challenge and potentially clear 102.86.
If the 10-year stalls while the 2-year remains stretched and Fed pricing continues to retreat from last week’s peak, DXY could instead struggle on its first approach to resistance and consolidate back toward the 99.7–99.9 moving-average area.
A deeper reversal would require more. One credible path would be WTI breaking below 89.14 and 86.90 while Treasury yields and Fed expectations retreat in tandem. That would attack the inflation-and-rates mechanism behind the rally rather than merely interrupt its momentum.
ISM and Payrolls Will Determine Whether the Rally Secures a Second Catalyst
Next week provides precisely the data needed to resolve the question.
Thursday’s September ISM Manufacturing PMI, due October 1, will test whether the exceptional strength in the S&P Global flash survey is visible across a different manufacturing sample.
Then Friday brings September nonfarm payrolls, scheduled for October 2 at 8:30 a.m. ET. That will be the more important test of whether the growth and labor backdrop remains strong enough to revive last week’s Fed repricing or instead allows the recent moderation in hike expectations to continue.
Last week established the first leg: stronger growth, renewed inflation pressure, and more Fed tightening were priced into yields and the Dollar. This week will determine whether that trade receives a second catalyst just as DXY reaches resistance. The Dollar still has room to run. The harder question is whether U.S. yields—especially the 10-year—can run with it.
Key Takeaways
- DXY closed at 101.03 after a hawkish Fed-driven two-week rally, now approaching genuine resistance at 101.80–102.86 rather than emerging from support.
- The 2-year yield is becoming stretched (RSI above 72) after surging to 4.912%, making the 10-year yield the cleaner remaining signal for whether the Dollar rally has further to run.
- A sustained 10-year break above its channel ceiling toward 5.413% would provide the strongest case for DXY clearing 102.86; a stall would risk a pullback toward 99.7–99.9.
- Oil is the clearest bearish-Dollar counterweight: WTI fell almost 8% last week on Hormuz diplomacy hopes, with a break below 86.90 support threatening the inflation-and-rates mechanism behind the rally.
- September ISM Manufacturing (October 1) and nonfarm payrolls (October 2) are the next tests of whether growth and inflation data can supply a second catalyst for the Dollar just as it reaches resistance.
Also Read
- Profiting from the Narrative: How X’s Creator Fund Pays for Bitcoin Hype Independent of Price
- ARK partners with Securitize to put a venture fund on Ethereum, but leaves exit doors locked
- FET Eyes $9 Target as Weekly Chart Signals Familiar Breakout Pattern
- EU Regulatory Body Calls for Assessment of DeFi Lending Frameworks


