


The EUR/USD pair hovered around 1.1430 on Tuesday as the U.S. dollar reclaimed March 2026 highs. This resilience is driven by expectations of further Federal Reserve tightening and cautious optimism surrounding U.S.–Iran negotiations.
Washington’s decision to issue Tehran a temporary 60‑day license to export oil bolstered hopes for a gradual rebound in global crude supplies and signaled progress in diplomatic talks.
Investor focus remains on the Federal Reserve. Following hawkish signals at the June meeting, markets are pricing in a possible rate hike as early as September, with major banks such as Deutsche Bank and Bank of America revising forecasts toward additional monetary tightening.
This week’s key catalyst will be the release of the PCE index, the Fed’s preferred inflation gauge. The data could shed light on the persistence of price pressures in the U.S. economy and shape expectations for future interest‑rate moves.
EUR/USD Technical Analysis
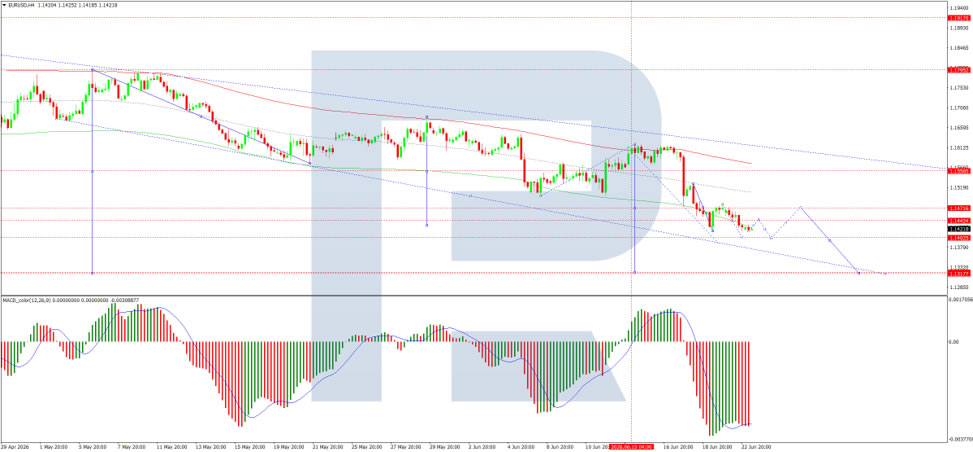
On the H4 chart, EUR/USD is consolidating around 1.1444, with the range currently spanning 1.1418‑1.1440. A breakout to the upside could trigger a corrective move toward 1.1470, followed by a decline to 1.1385. Conversely, a downside break may open a path toward 1.1315.
The MACD supports a bearish bias: the signal line sits below zero and slopes sharply downward, indicating persistent down‑trend momentum.
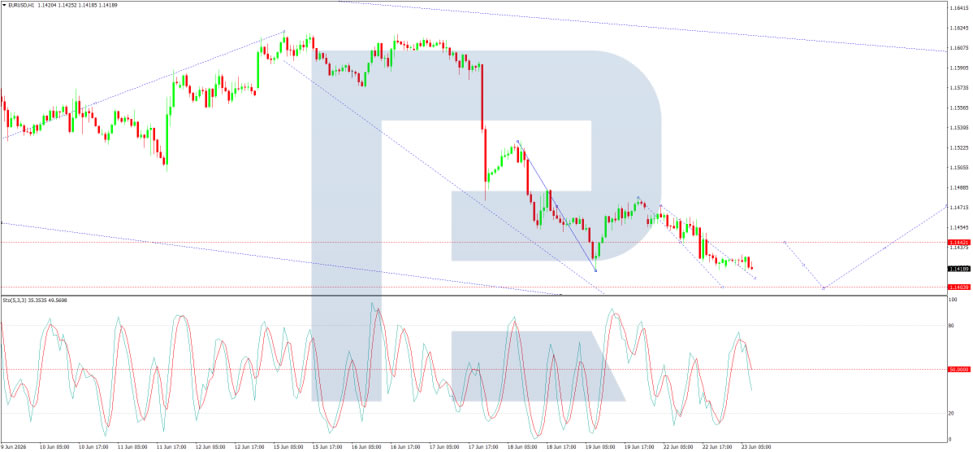
The H1 chart shows a completed growth wave up to 1.1449, now entering a consolidation zone between 1.1409 and 1.1444. A subsequent decline toward 1.1385 is anticipated.
The Stochastic oscillator aligns with this outlook, with its signal line below 50 and trending steadily toward the 20‑level.
Also Read
- UK PMI Report Reveals Continued Contraction Amid Weak Services
- Bitcoin Downside Appears Limited as Lagging Bear Cross Signals Potential Bottom
- World Finance Awards 2026 Affirm Trusted, Reliable FX and CFD Trading for Clients Worldwide – The Manila Times
- Sterling Faces Critical Thresholds Amid UK Political Turmoil